Trading Hub 4.0 (Part 5): Applying the Entry Steps with Hub 4.0
This part will bring together the knowledge in Trading Hub 4.0 and explain everything to readers in detail, step by step. How to determine structure, determine the pattern, what you need to determine before buying or selling, and where you should place SL and TP.
The steps to determine before executing a trade according to Trading Hub 4.0
- First, determine whether the trend is bullish or bearish.
- After knowing what the market trend is, determine the impulsive wave and the corrective wave. If the market creates an impulsive wave, wait for the corrective wave to adjust.
- Next, determine the flag pattern. If the market is bullish, determine a bullish flag pattern; if the market is bearish, determine a bearish continuation flag pattern.
- Apply the 50 EMA as an additional confirmation condition; when price has a rejection reaction from the EMA 50 line with a strong candle, we can buy or sell.
- Enter at the strong bullish/bearish candle. Place SL below/above the structure and TP at a 2R ratio (you can place 3R or 4R depending on your risk appetite).
Applying the Hub 4.0 trading steps in practice
Apply the steps above to real trading according to the Euro/Canadian pair chart below.
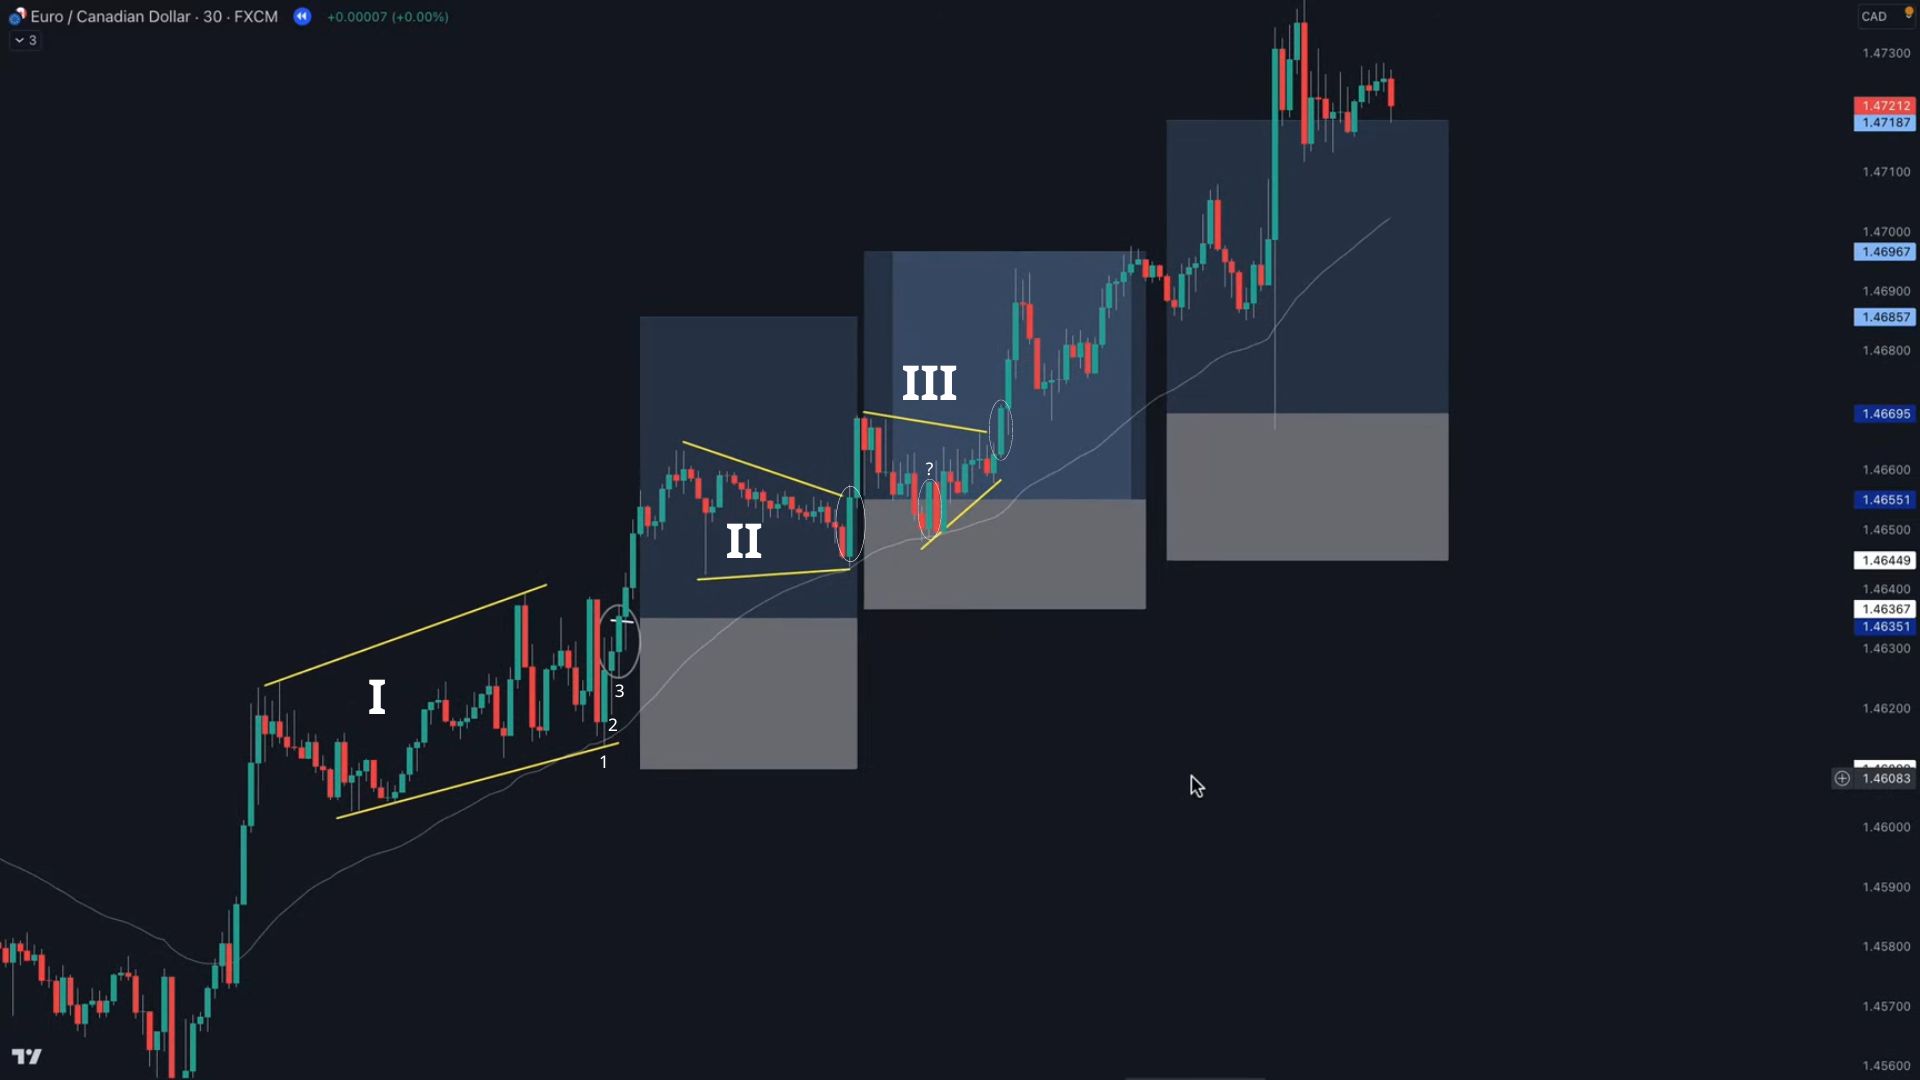 Entering with the flag pattern and EMA 50
- The dominant trend is a bullish uptrend.
- Determine the impulsive waves and the corrective waves; at each corrective leg a flag pattern will be created.
- There are 3 bullish continuation flag patterns as in the image.
- Applying the EMA 50 line, we determine the positions that reject the EMA 50 with a strong bullish candle.
-
Buy at the bullish candle appearing at the flag (you do not need to wait for a breakout of the flag). There are 3 flags as follows:
-
At the first flag, after rejecting the EMA, there are 3 candles marked as in the image. Candles 1 and 3 are bullish candles, however candle No. 3 has a longer lower wick so it is stronger than candle No. 1; we will buy when this candle ends.
- At the second flag, a clear bullish candle forms after rejecting the EMA 50; we buy as soon as this candle ends.
- The third flag is harder to identify because the candle rejecting the EMA is a bullish candle but it appears when the flag has not yet formed clearly (marked with a question mark); if we buy at this candle it will not have a high probability because the flag will very likely expand and price will continue to touch the EMA several more times. After the flag has formed, we then determine the entry at the bullish candle as in the image.
Place the stop loss below the flag and take profit at an R:R ratio = 2:1.
The hardest thing is determining the flag accurately. At the LTF, a flag can expand into a larger flag and contain many small flags inside it. This can interfere with our initial trend determination. Stay tuned for the next part: multi-timeframe analysis.
The second hardest thing is accurately determining the entry candle. Not every bullish candle can be used to enter. Wait for the flag pattern to form and for the rejection of the EMA 50 line.
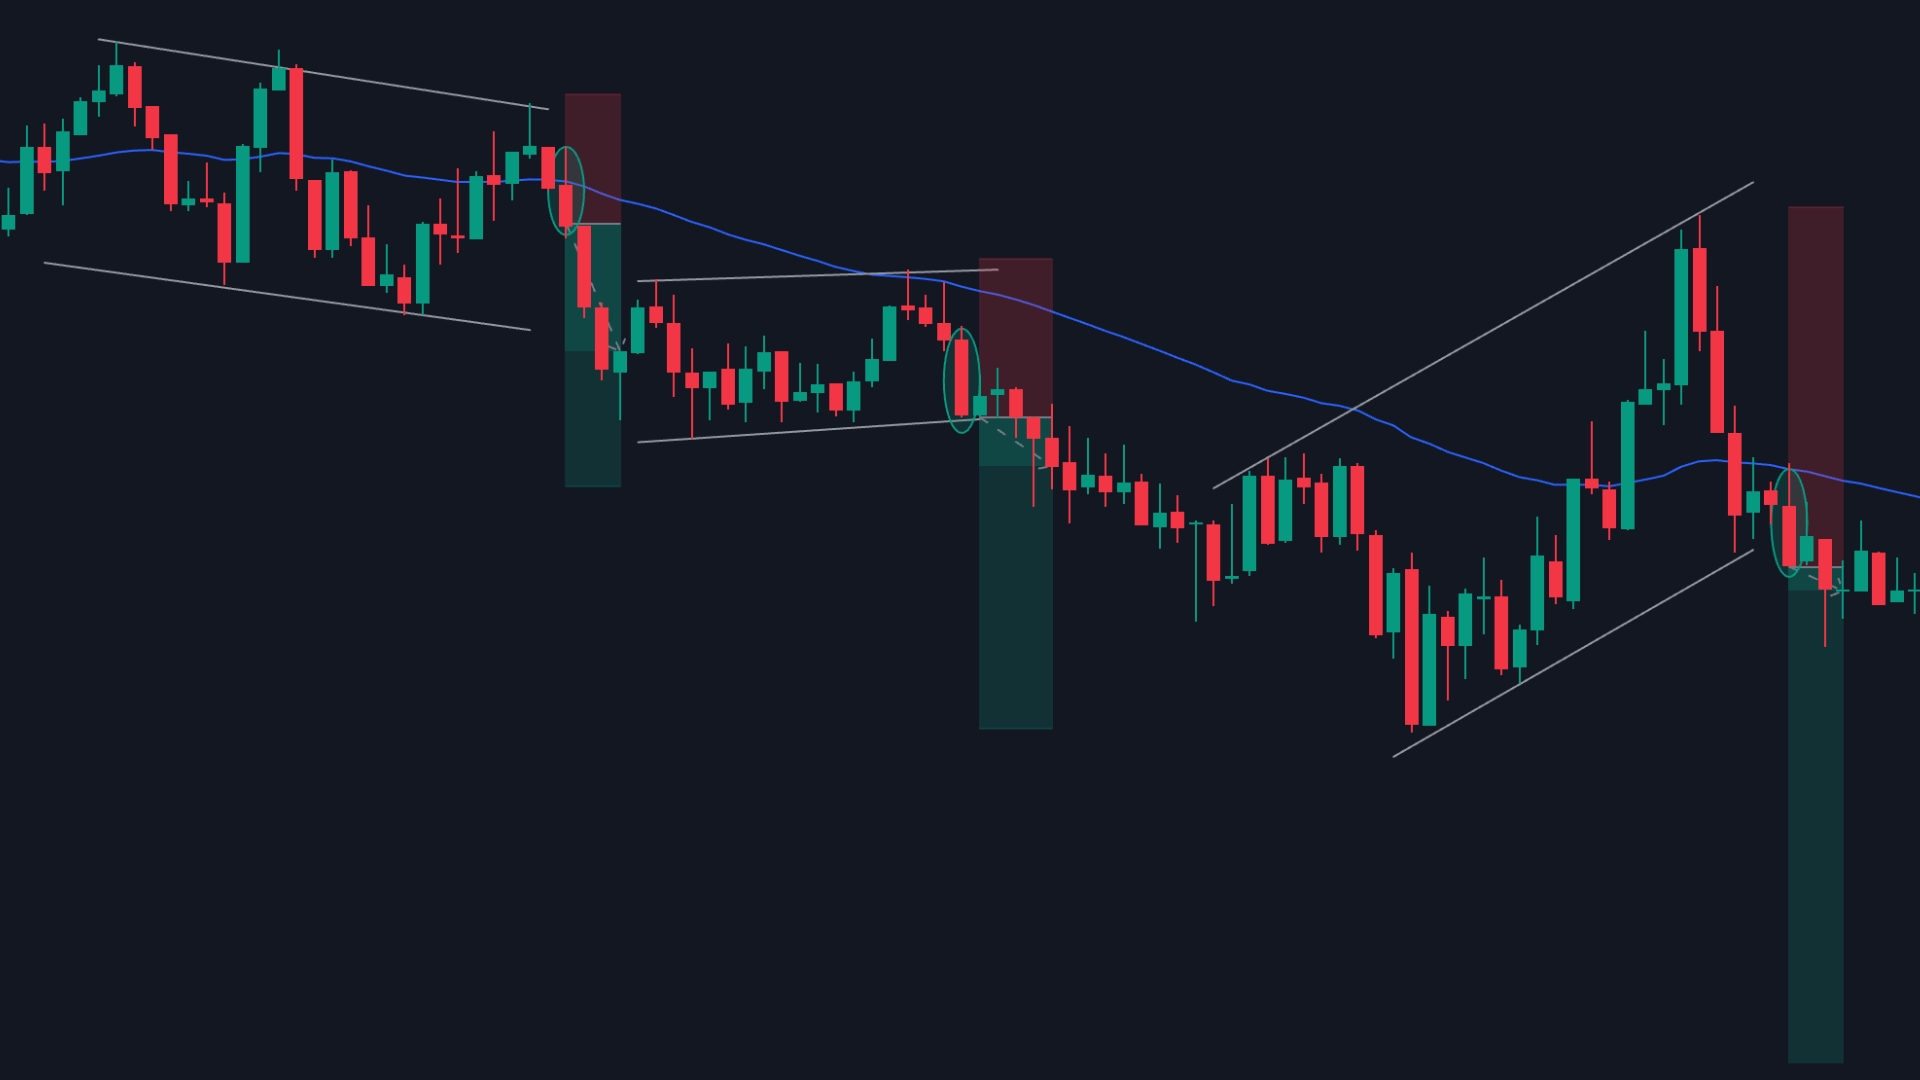 A qualifying sell entry
5/5 - (1 vote)
Read structure 10x faster with JUKA
JUKA maps SMC structure — swings, BOS, CHoCH and inducement zones — automatically on any TradingView chart. No more hand-drawing structure for hours.
Get JUKA — $150