Wyckoff Part 6: The Re-Accumulation Phase and Its Patterns
What is re-accumulation?
Re-accumulation in Wyckoff is the result of an uptrend needing to go through a consolidation phase before it can continue rising.
At the starting point of an uptrend, the CO controls the market, but as price rises higher, potential supply from the public begins to appear.
When the public holds inventory, they will want to take profit at high prices, making it harder for the CO to push price up.
At this point, we say that the quality of ownership of the asset is poor and the market needs to restart the absorption process so the CO can optimize their inventory.
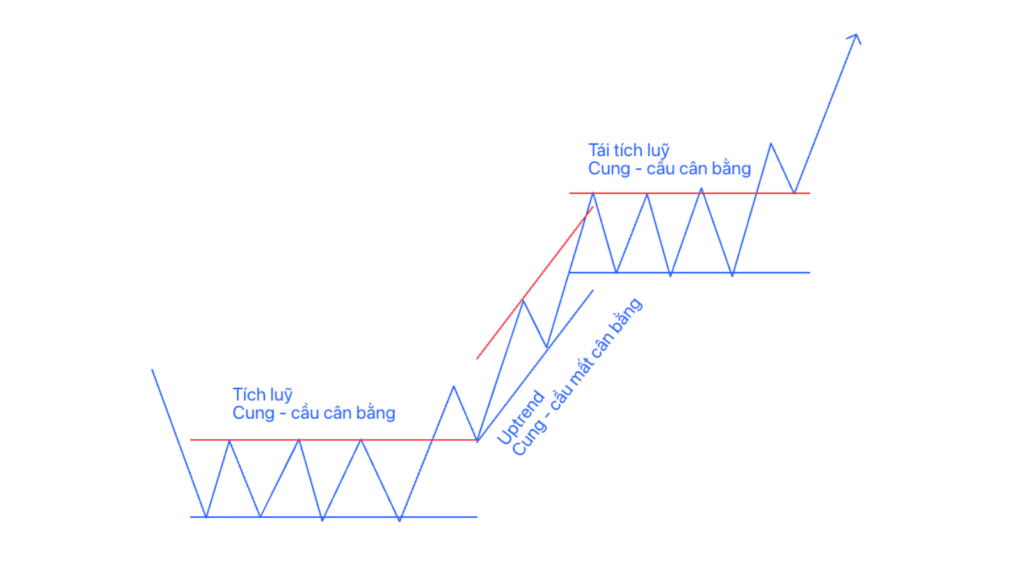 Figure 1: How re-accumulation is formed
In an uptrend, there is only one accumulation phase, but many re-accumulation phases will appear.
When the price target of the accumulation process has not yet been reached, a re-accumulation structure is formed to add more demand to push the uptrend up to the target price.
Analyzing an uptrend
The momentum of an uptrend is established early in phase E of the accumulation structure.
Develop the habit of drawing trendlines/trend channels along the trend or counter-trend trendlines/channels to analyze the Uptrend phase.
Analyzing a rising price channel is an extremely important technique in Wyckoff methodology, because overbought or oversold points are shown when price exceeds the boundaries of the price channel.
When price is inside a rising channel:
- Price exceeding the supply line shows overbought and that the uptrend is about to stop (not a sell signal).
- Price making a false break through the demand line shows oversold and is an opportunity to consider buying.
- If price breaks the demand line deeper than normal, price may fail in its attempt to return to the top of the rising channel. But if price recovers and rises to make a new high, it is highly likely the uptrend will continue (as stated in part 1).
- When price approaches the demand line but does not touch it, that shows the strength of the uptrend.
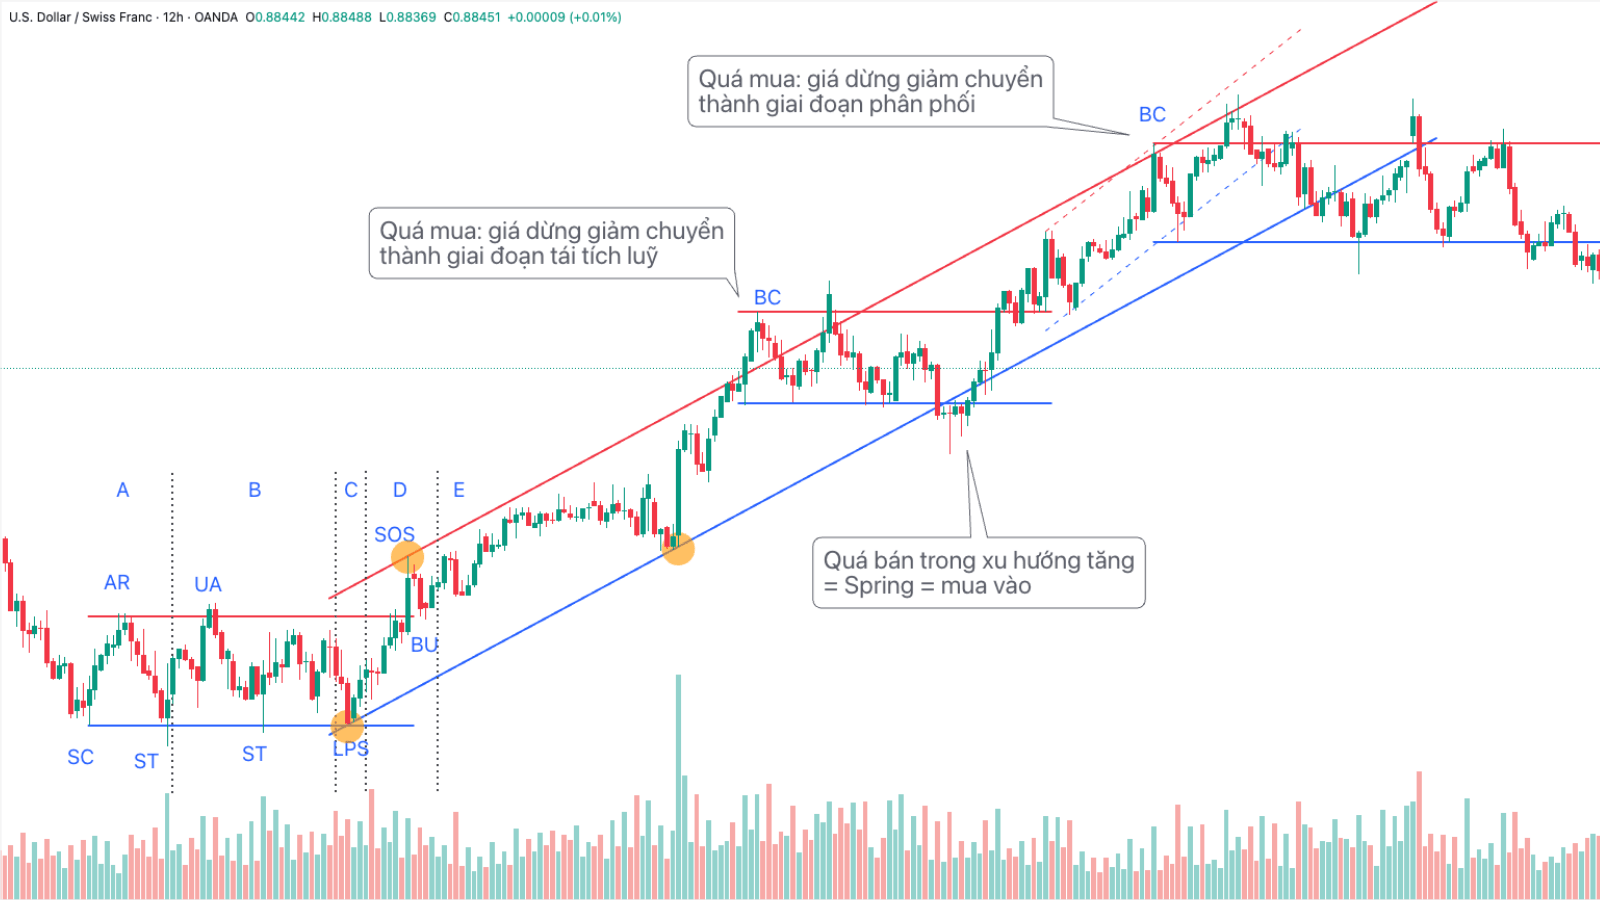 Figure 2: Uptrend in the USD/CHF currency pair
Figure 2 is a perfect example for analyzing an uptrend in the USD/CHF forex pair:
- After the accumulation phase, the uptrend forms clearly from phase E, but in reality it began at the bottom of phase C (LPS).
- A rising price channel is drawn from three orange points, the demand line drawn first from two low touch points and the supply line drawn parallel through the middle touch point.
- Price rises above the supply line showing overbought (BC), meaning the uptrend stops; this is not a sell signal.
- A re-accumulation phase forms afterward, with the Spring event being an oversold point that exceeds the demand line. Price returning into the price channel is a buy signal.
- Price continues rising with a strong uptrend, shown by price approaching but not touching the demand line. In reality that is an uptrend after the re-accumulation phase lying inside a counter-trend price channel (dashed line).
- Price makes a false break through the supply line, showing overbought (BC). The uptrend stops; it is not a sell signal.
- A distribution phase forms afterward, moving outside the demand line of both price channels.
The re-accumulation structure
The re-accumulation structure is similar to the accumulation structure, consisting of 5 phases and events. The only difference lies in how it begins to form.
The accumulation structure begins with the action of stopping a downtrend, while the re-accumulation structure begins with the action of stopping an uptrend.
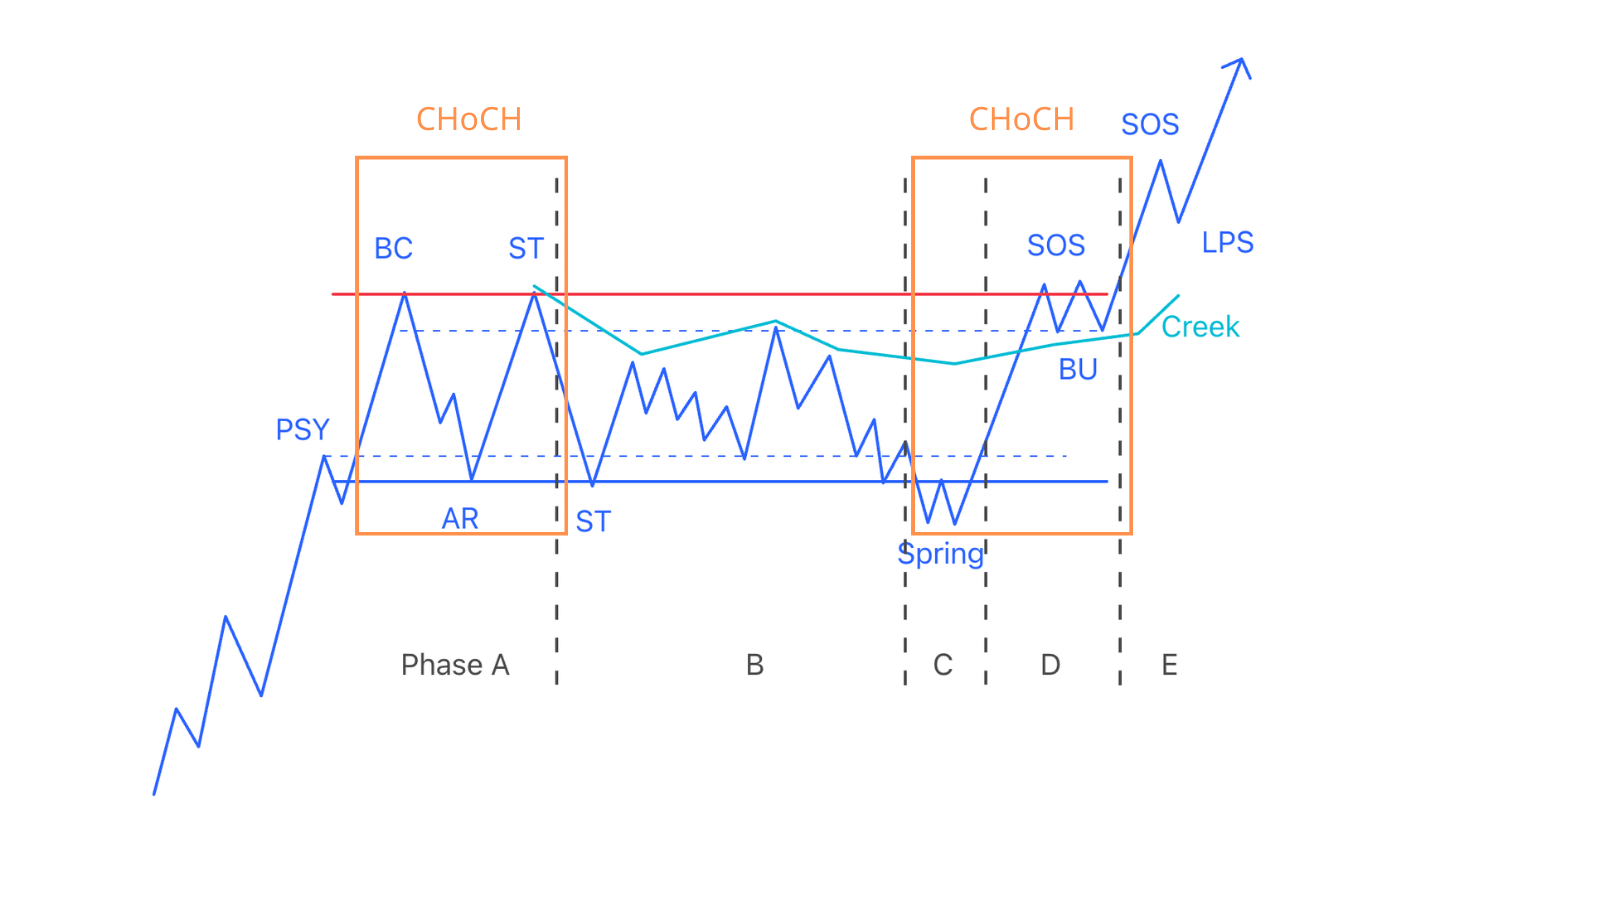 Figure 3: The phases and events of the re-accumulation structure
Looking at figure 3, we have a typical re-accumulation structure with phases and events as follows:
Phase A: Stopping the uptrend
PSY (Preliminary supply)
The public no longer holds inventory because after the accumulation phase they were fully absorbed by the CO; they can only chase price upward along the rising momentum.
On the way up, short-term public buyers begin tentatively taking profit.
This is the first effort to stop the price increase, however this effort always fails because the upward momentum is too strong.
PSY may exceed the price channel (on large volume) or may not.
PSY may appear or may not. If it does not appear, it means the CO senses strong supply and they join in taking profit, causing PSY to become BC.
BC (Buying climax): Overbought
After the failure at PSY, FOMO buying the dip with strong demand leads to the buying climax event BC, with expanding range and maximum volume.
This is precisely where the CO and the potential supply from people who were trapped at highs in the past appear, causing price to be unable to rise further even though most retail traders are rushing in to buy along the uptrend.
This event is easier to recognize if BC moves outside the rising price channel.
This supply creates a large decline with strong range, much larger than all previous declines (the first CHoB).
The appearance of BC signals the stopping of the uptrend (not yet a sell signal).
Note that volume at BC is not always high. If at PSY the uptrend was mostly absorbed by the CO, then at BC volume will be small with gradually narrowing range.
AR (Automatic reaction)
The halting of the uptrend at SC causes price to react downward to create AR, establishing the lowest low of the trading range.
At AR, short-term buyers at the top are fearful of heavy losses, causing them to "release their inventory" into the hands of the CO.
The CO uses their money to absorb all the selling pressure so that price cannot fall any deeper.
ST in phase A: Secondary test
The CO appears to absorb supply, causing price to bounce back up, creating the second CHoB.
When it reaches the old BC high to test supply and demand, it forms the ST event and ends phase A.
At the ST high, price changes behavior a third time, moving down to begin phase B in order to retest the AR low.
3 CHoBs = CHoCH → Price officially changes character from an uptrend to sideways.
From BC and AR you can draw two parallel lines, which are the TR.
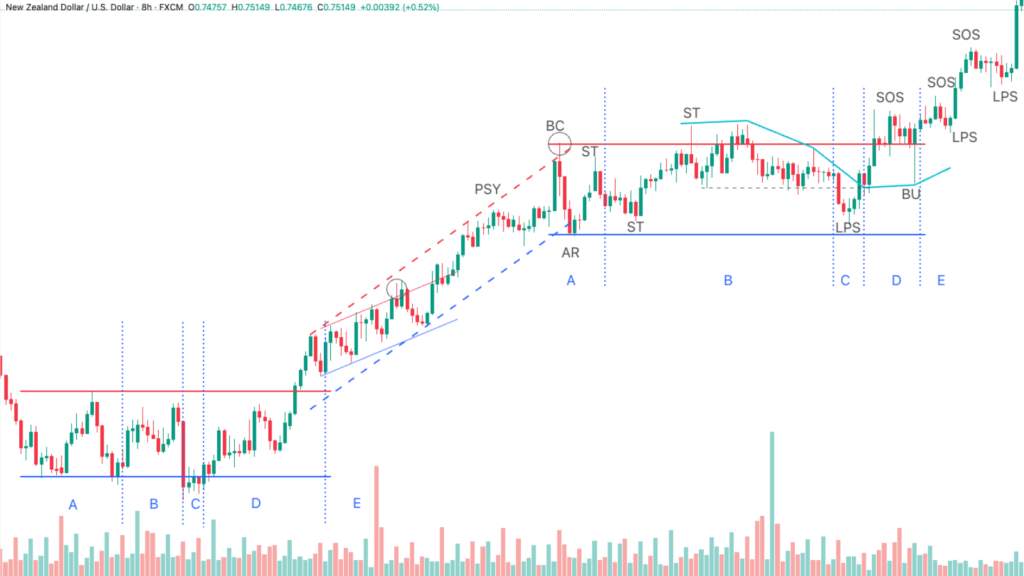 Figure 4: Re-accumulation in the NZD/USD currency pair
In figure 4, we see price reach an overbought state at the reversed price channel (dashed line) and enter a sideways phase.
Before that there was one overbought occurrence at a smaller along-trend price channel, but price only created two CHoBs before rising to continue the uptrend. Without a full three changes of behavior, we cannot yet draw a TR in that area, and that is also why we should not sell as soon as a buying climax appears.
Phase B: Building a cause
Phase B is the period when price continuously tests supply and demand at the upper and lower boundaries of the TR.
Price has strong fluctuations that create bull traps or bear traps at the top area and reactions down to the TR low; weak supply will be eliminated by these fluctuations.
All of these actions happen very quickly.
However, just like in the accumulation phase, these price fluctuations gradually decrease over time, showing the character of supply absorption.
Typically, declines down to the lower boundary will take more time to complete and trading volume will be lower after each decline.
Phase C: Testing supply at the low
The CO begins to shake out participants positioned at the lower boundary with a Spring event (figure 5).
Depending on the strength of supply, the CO will make the next decision:
- If supply is low, the CO can absorb it all and push price up into phase D.
- If supply is still plentiful, the CO feels that the path upward is costly; they will continue to prolong the absorption process or will give up and let the market go into distribution.
Note: Depending on market conditions, remaining supply, and the CO's intent, a Spring in a re-accumulation structure may appear or may not.
If there is no Spring, price only creates an LPS as in figure 3. This LPS is a shakeout of a small local accumulation phase.
Phase D: Showing strength
SOS (Sign of Strength)
After determining that supply is low, the CO easily pushes price up to break out of the TR, forming an SOS with wide range and rising volume, showing demand > supply.
This is the first CHoB.
Phase D SOS can also be considered a JAC because price has broken through the Creek.
In the process of price rising to create an SOS, there will be pullbacks on small volume. Those are LPSs and are also good entry points.
LPS in phase D: Last point of support
After breaking through the TR, price from the SOS pulls back to the Creek to test potential supply.
Just like in the accumulation phase, we call this test phase LPS or BU. This is the second CHoB.
If remaining supply is weak, shown by small trading volume and gradually decreasing range, the CO will push price up further into phase E.
That is the 3rd CHoB.
3 CHoBs = CHoCH → Price officially changes character from sideways to an uptrend.
Phase E: Uptrend outside the TR
Price breaks through the SOS high and officially enters an uptrend, with consecutive SOSs and LPSs appearing, creating higher highs and higher lows.
Example: We will zoom in on the re-accumulation phase of the USD/CHF forex pair in figure 2 to analyze this typical structure.
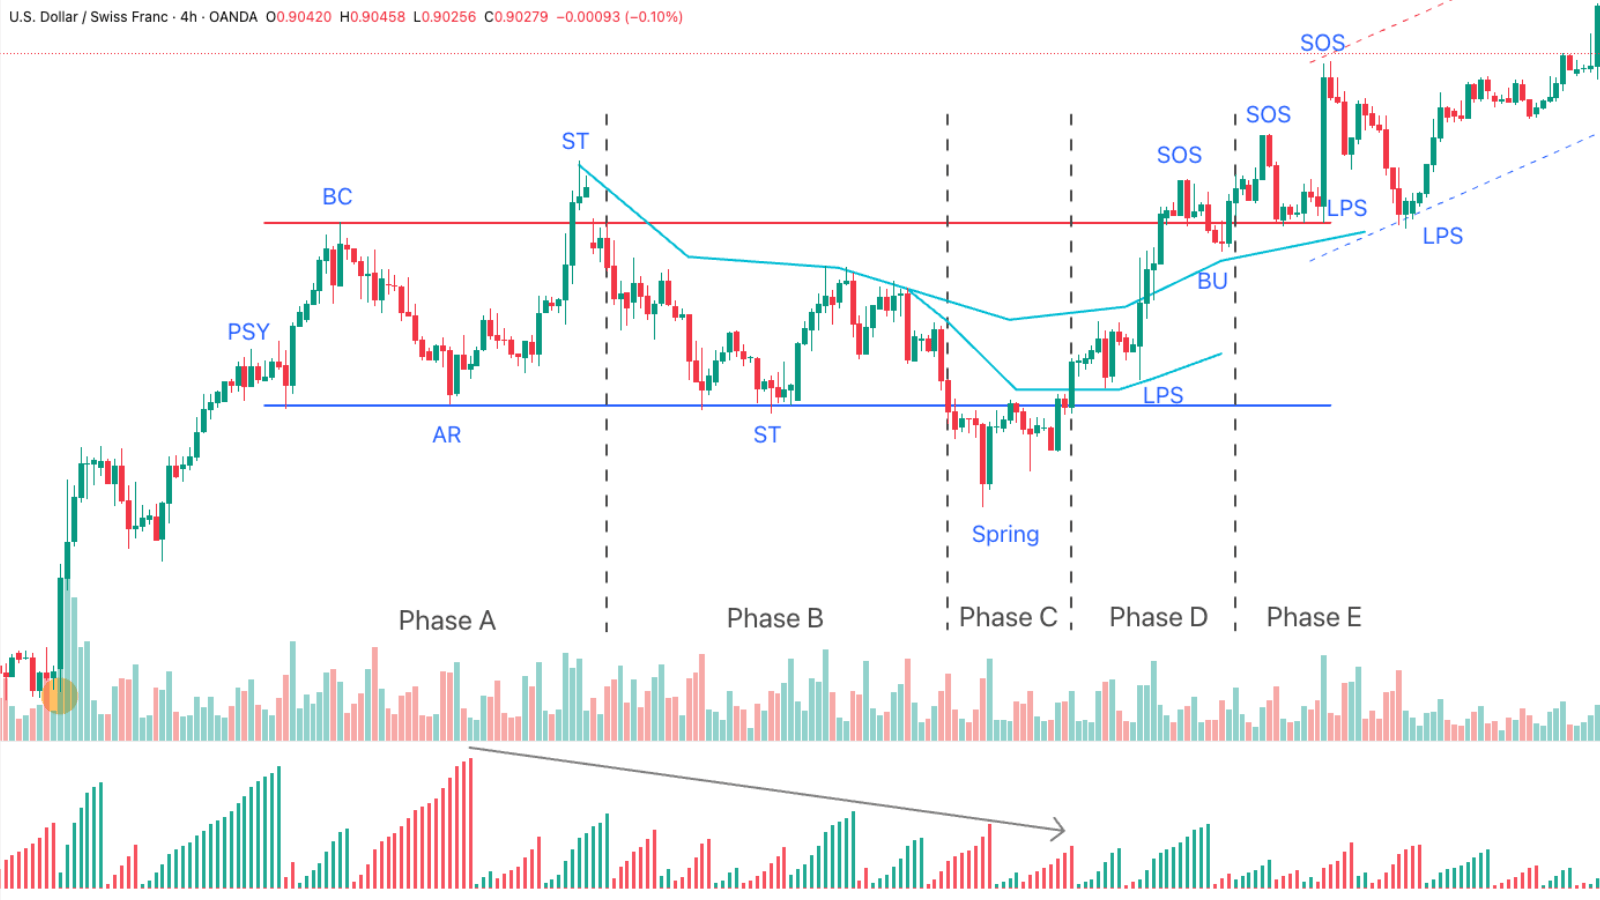 Figure 5: Re-accumulation structure with a Spring in USD/CHF
- During the development of the TR, volume gradually decreases from phase A to phase C → Supply absorption is occurring (the Weis Volume indicator will be covered in later articles).
- At phase C, the Spring shakeout causes the public to panic-sell and buyers in the lower boundary area get their stop losses hit. After that, price rises and breaks through both Creek lines with a long-bodied candle on rising volume.
- This Spring point is also the oversold position at the rising price channel of the larger timeframe (see figure 2 again); this confluence suggests a rise after price returns into the price channel.
- LPS and BU are suitable positions to open buy positions.
Signs of re-accumulation
It is really hard to distinguish between a re-accumulation structure and distribution, because it depends on the potential supply in the market.
During the time the TR forms and develops, a Wyckoff analyst will study the signals of price (spread) and volume to determine whether it may be a re-accumulation phase or a distribution phase in progress.
Just like in the initial accumulation phase, the CO will have a strategy to absorb supply whenever price corrects down to support levels and they will stop buying activity when price rises back to resistance levels (except for SOS).
Price will often have difficulty returning to support levels (except phase C), and this will be reflected on the chart with narrowing price ranges and gradually decreasing trading volume (supply decreasing).
We will study the differences from distribution in more detail in later parts.
Re-accumulation structure patterns
The re-accumulation structure has many different shapes and variations. Depending on potential supply and the CO's intent, different forms are created.
Below are some commonly seen re-accumulation structure shapes.
Form 1: Re-accumulation with Spring action
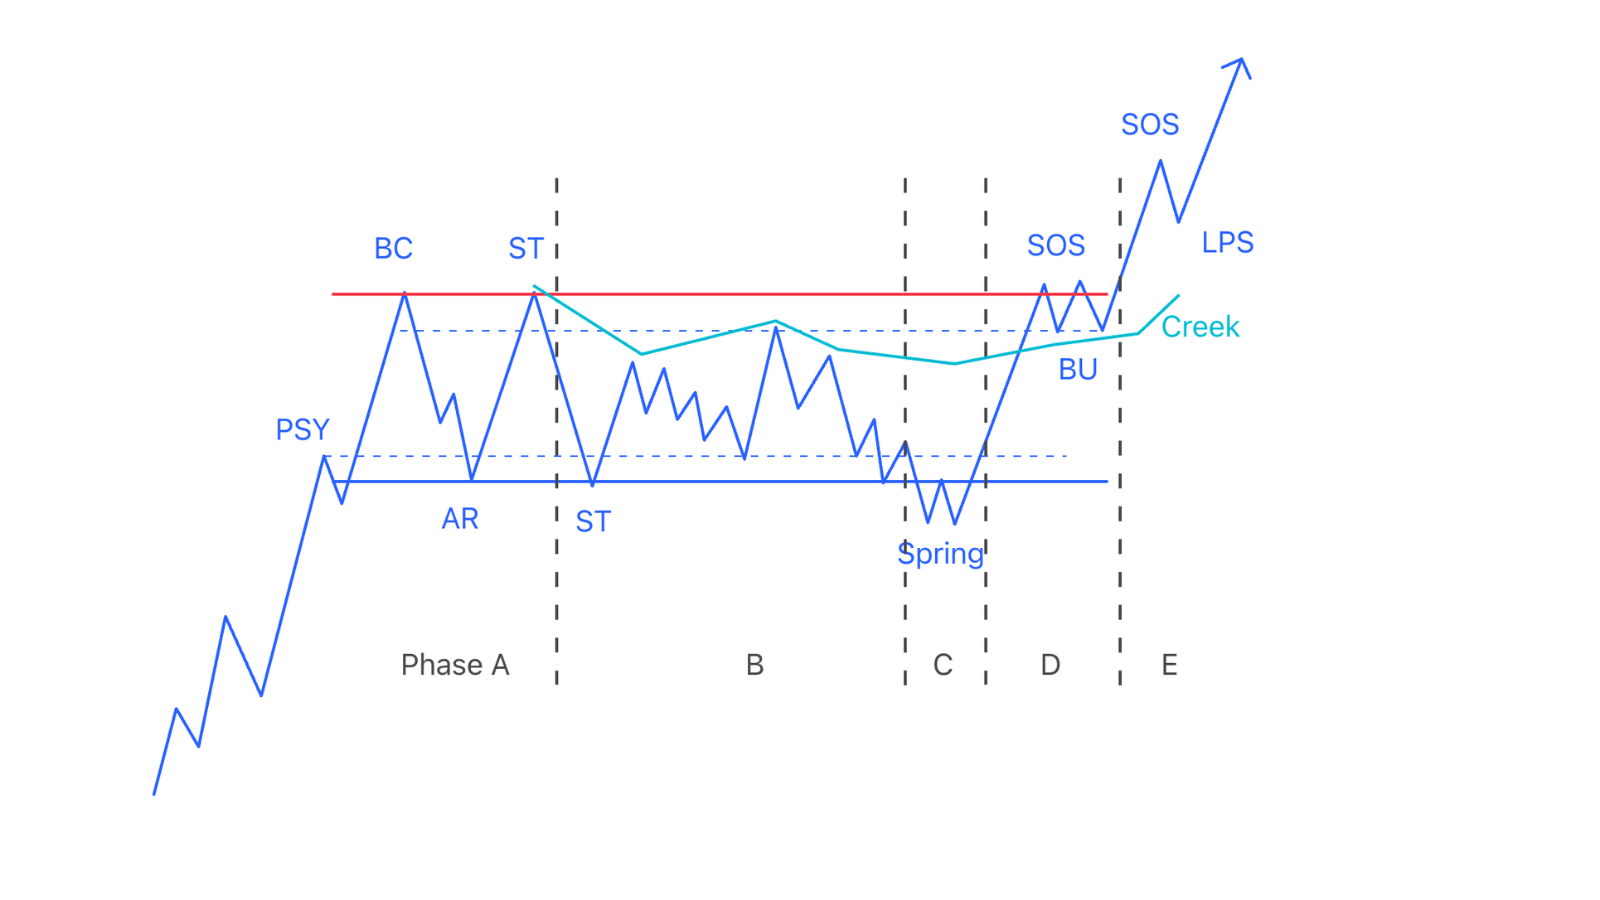 Figure 6: Re-accumulation with Spring action
This pattern is called Reaccumulation with Spring action. Characteristics:
- The TR forms in a flat or downward-sloping shape (sloping TR variations will be covered later).
- Several lower lows may appear, with the Spring being the lowest point in the TR.
Example of the $AMZN stock re-accumulating on the 3D timeframe:
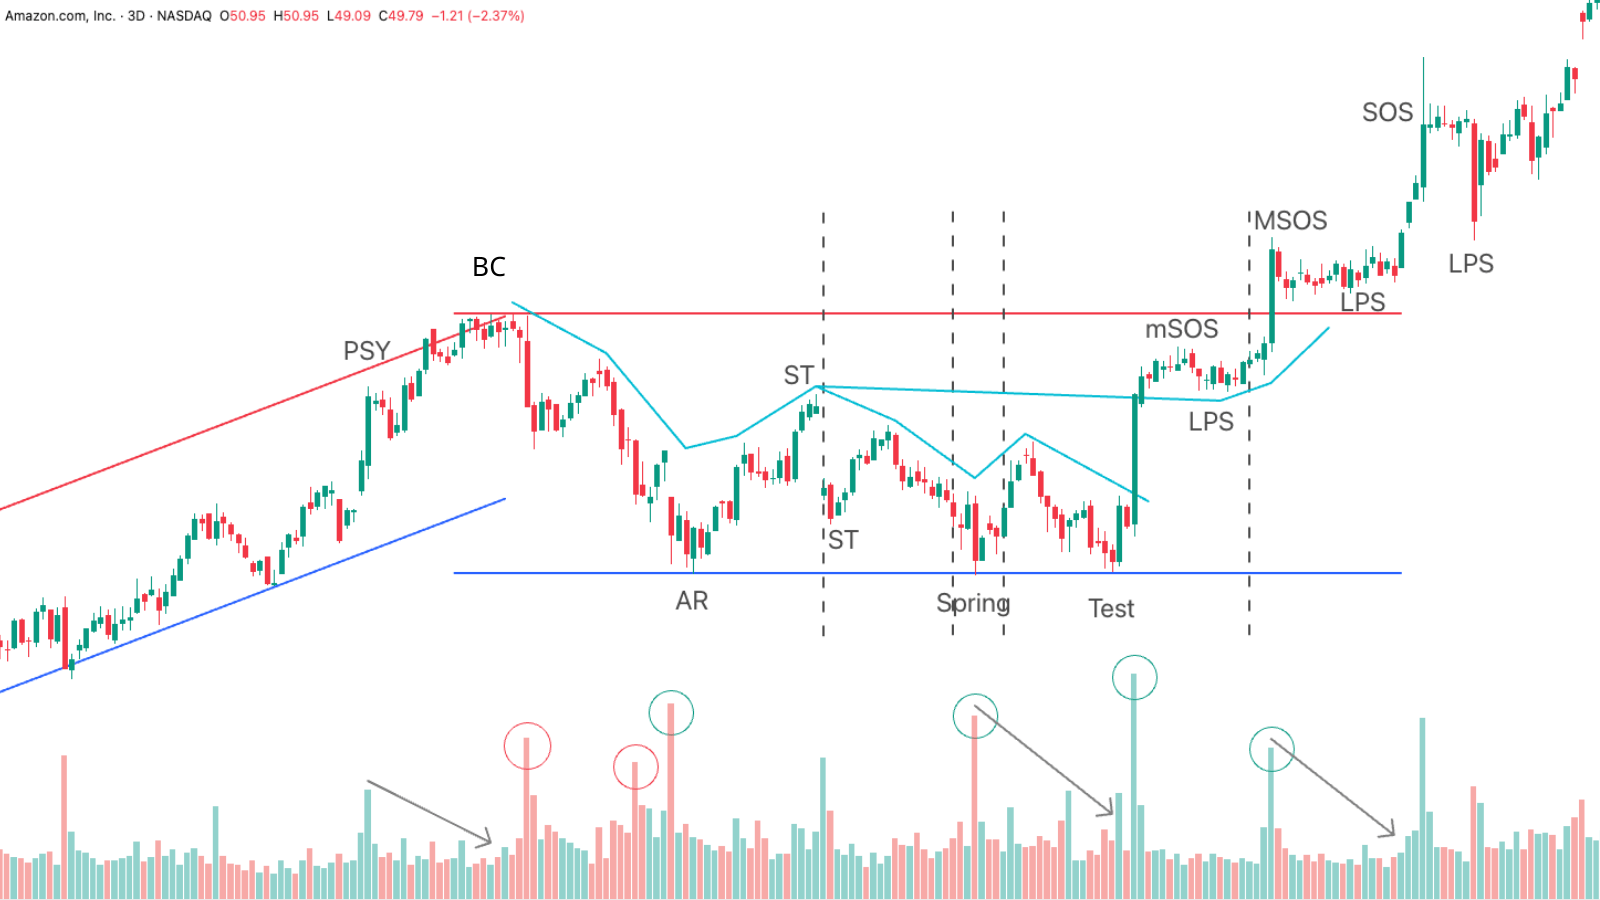 Figure 7: Amazon stock re-accumulation structure
- Overbought BC appears, exceeding the rising price channel with gradually decreasing volume and narrow range → Demand weakens and price stops rising.
- At the red-circled positions corresponding to the highs and price leaving the high level, high volume shows supply pressure at the start of the TR causing price to fall quite deeply.
- At the blue-circled positions corresponding to the lows and price recovering from the lows, high volume shows strong demand toward the end of the TR.
- The Spring test candle has lower volume than the Spring, showing that supply has been exhausted.
- Price breaks through the Creek with a long-bodied candle closing near the candle high on large volume, creating a minor SOS, followed by a mild correction, an LPS on small volume showing demand dominating supply.
- Next, price breaks through the upper boundary of the TR creating a Major SOS on high volume, showing the CO continues buying and absorbing all the large supply on the upper boundary; the LPS correction cannot even return to test that boundary → Supply has truly been exhausted.
- Suitable points to open buy positions are the rising candle after the test phase, and the LPSs.
Form 2: Re-accumulation with a long absorption time
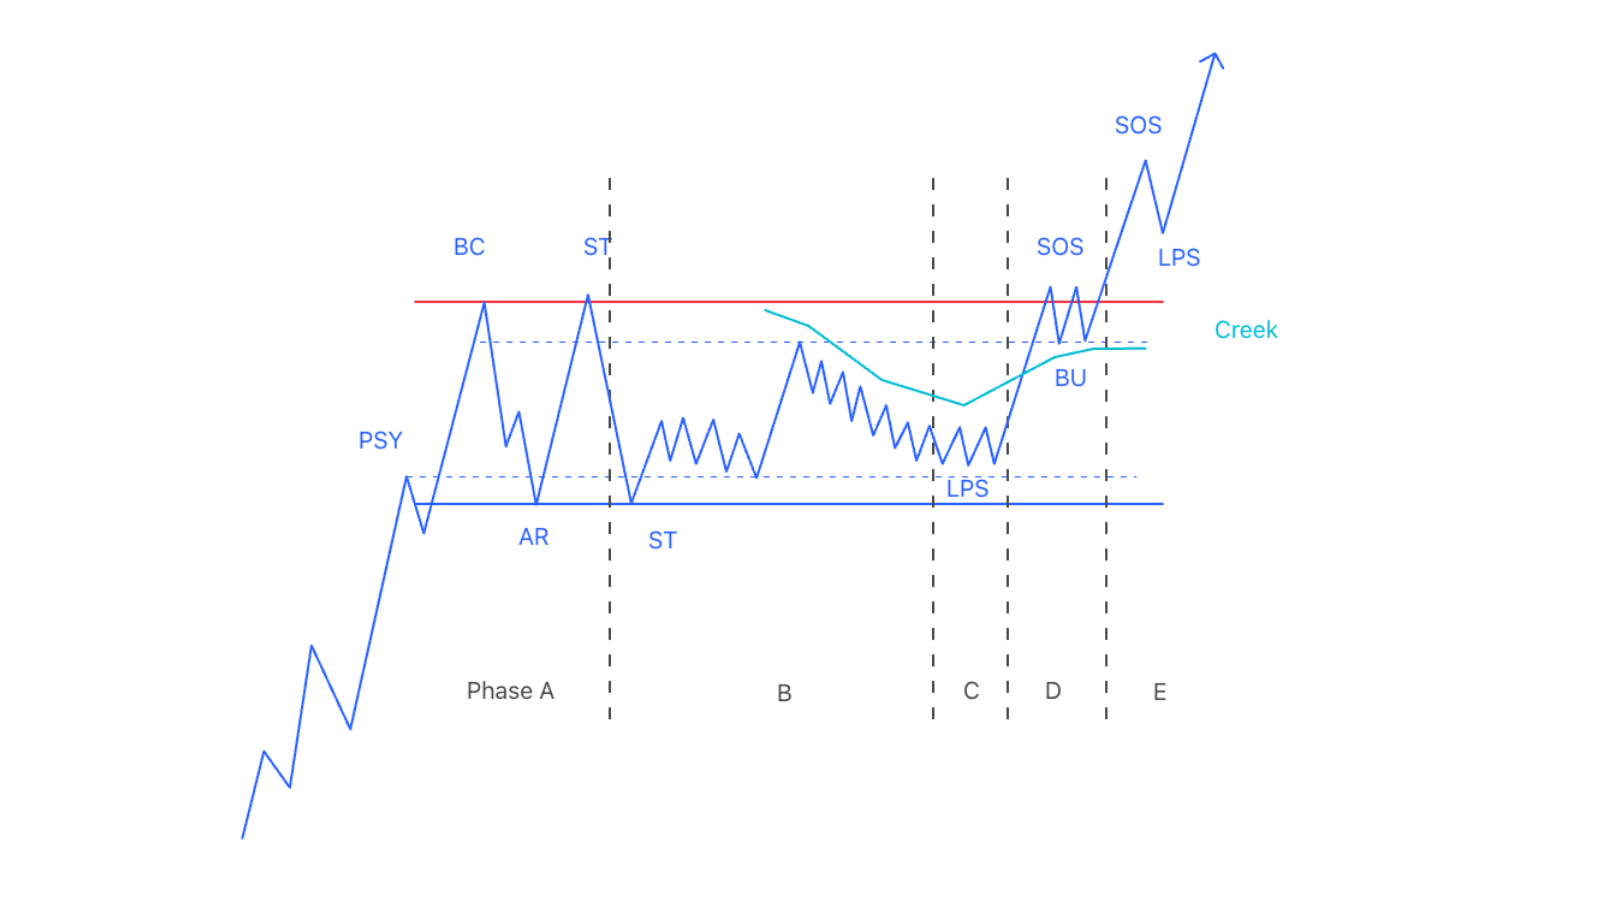 Figure 8: Re-accumulation with a long absorption time
This is the Reaccumulation after shakeout pattern. Characteristics:
- Supply absorption occurs inside the TR without making price touch the support boundary line.
- It shows that the CO's effort to absorb supply does not make price fall deeper.
- Candle range gradually decreases from phase A to phase C.
Example of $BTC re-accumulating on the 12h timeframe:
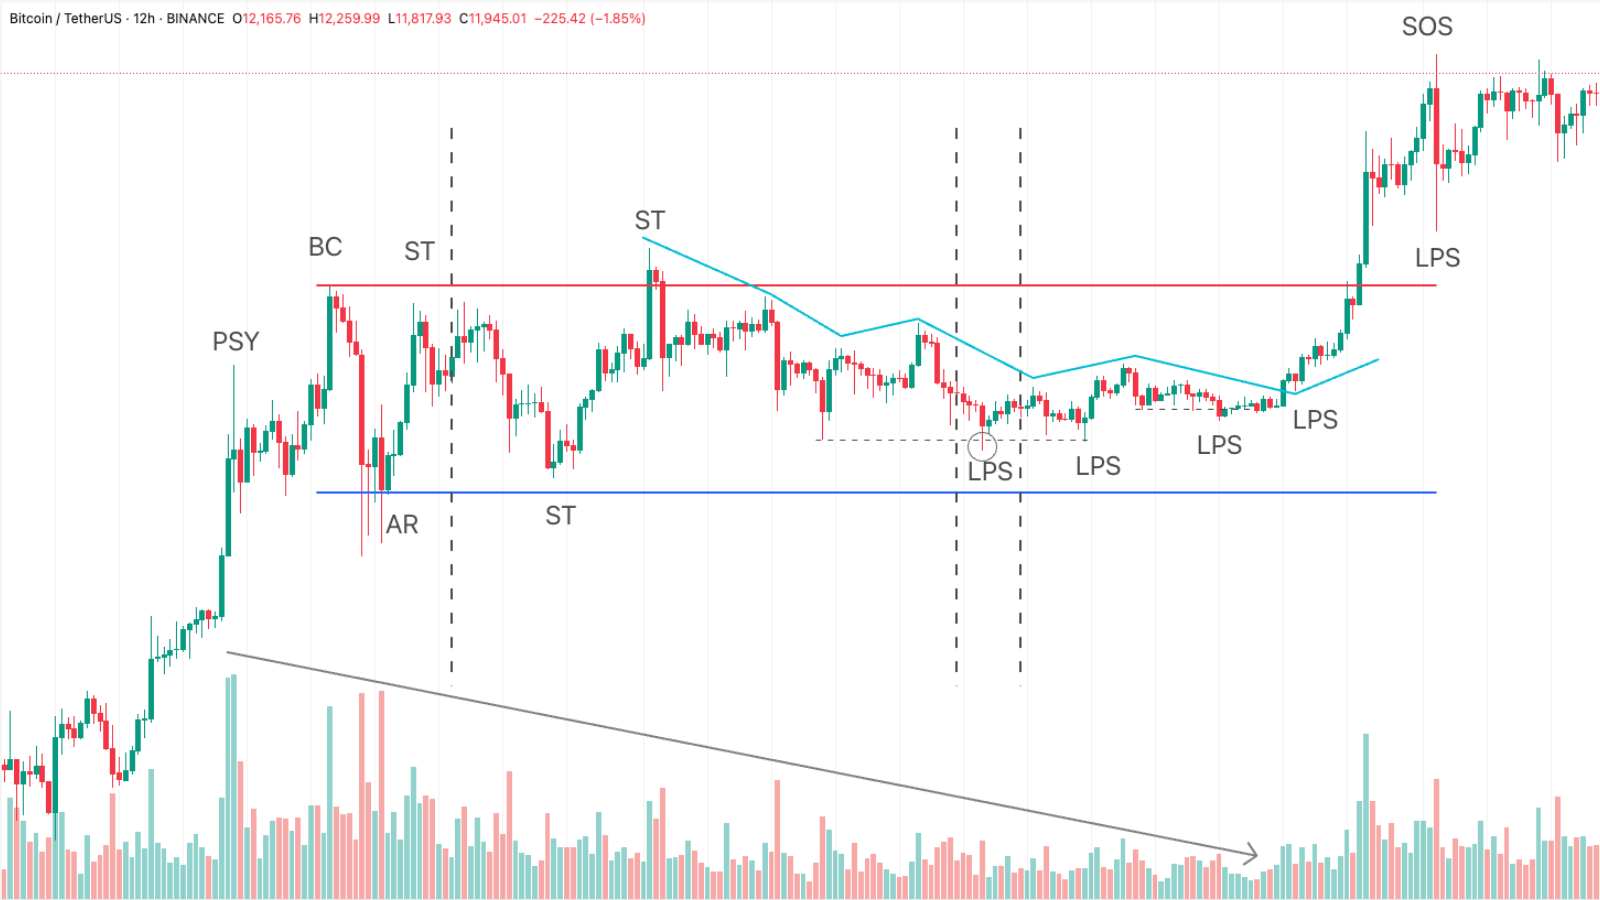 Figure 9: Bitcoin re-accumulation structure
- Volume and candle range gradually decreasing toward the end of the TR is a typical feature of supply absorption.
- We have two LPSs acting as two shakeouts in the smaller structure, on exhausted volume.
- Price breaks up through the Creek with gradually increasing demand, showing demand > supply.
- The entry point is at the strong rising candle after the LPS tests.
Form 3: Re-accumulation showing strength
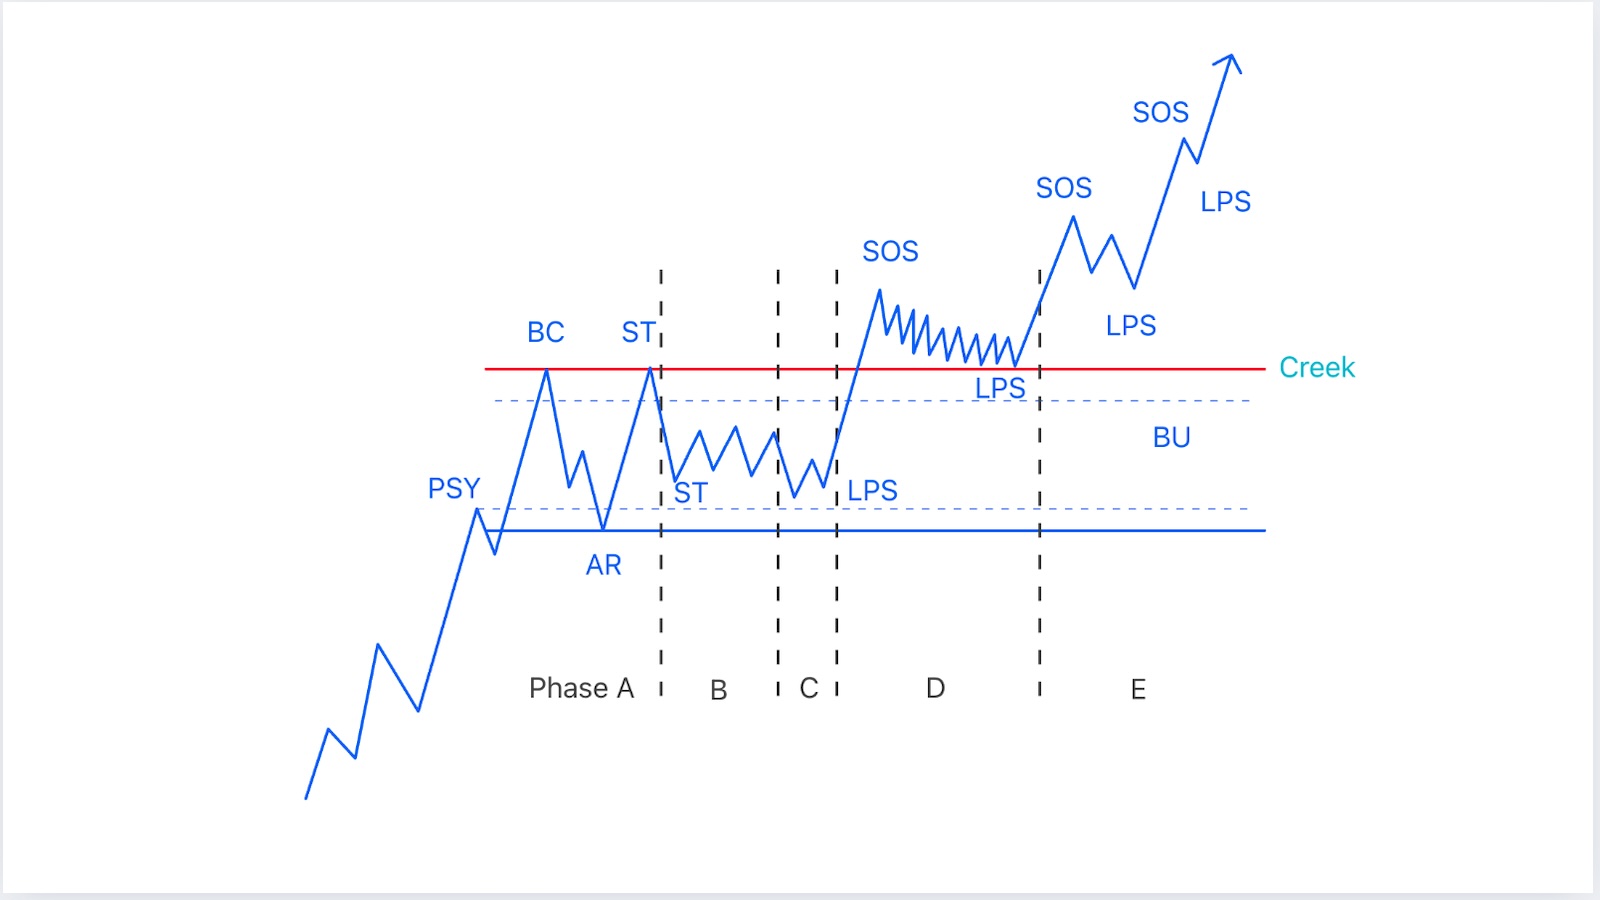 Figure 10: Re-accumulation structure showing strength
This is Reaccumulation with uprise:
- It is the strongest form of re-accumulation; the TR can be drawn horizontally or sloping.
- It is shown through higher highs and higher lows, with no Spring.
- It shows the CO's haste to push price up after realizing supply has been fully absorbed.
Example of the NZD/USD currency pair with a strength re-accumulation structure:
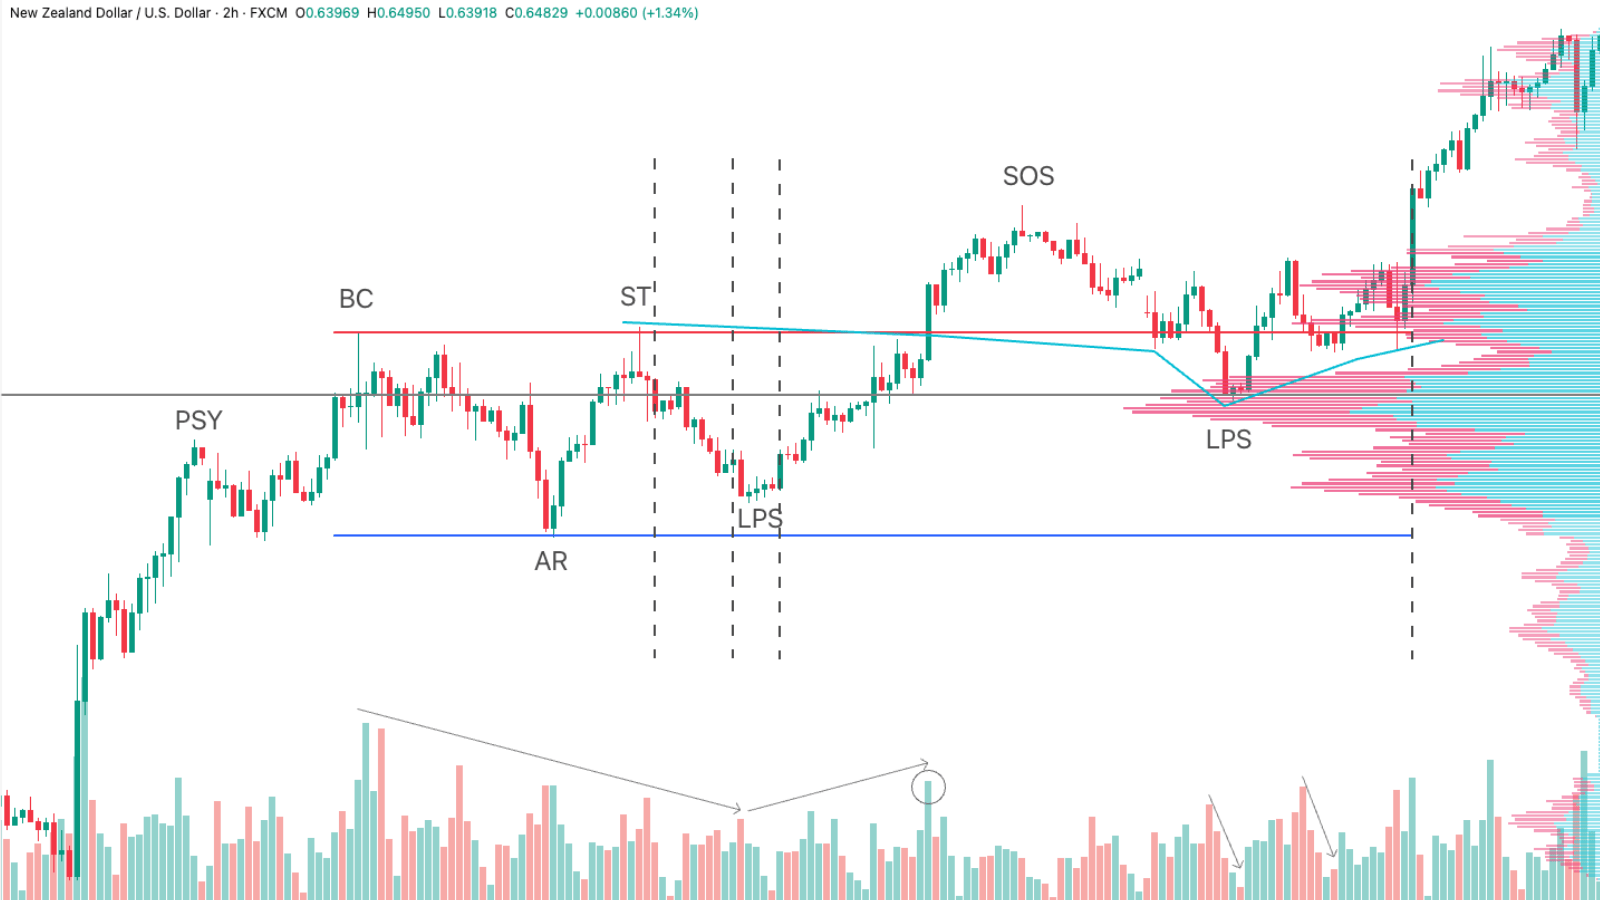 Figure 11: Re-accumulation showing strength in NZD/USD
- Volume gradually decreases while price is still inside the structure, showing absorption.
- After that, price hastily breaks up above the TR with rising volume and higher highs and lows, showing overwhelming demand.
- Phases where price falls back into the TR have gradually decreasing volume, showing rejection of the TR.
- When returning to the TR, price goes down to the POC of Volume Profile and then bounces up quickly (the Volume Profile indicator will be covered in later articles).
- Safe points to open positions are strong candles bouncing back after testing the POC and the upper boundary.
Form 4: Re-accumulation after a decline
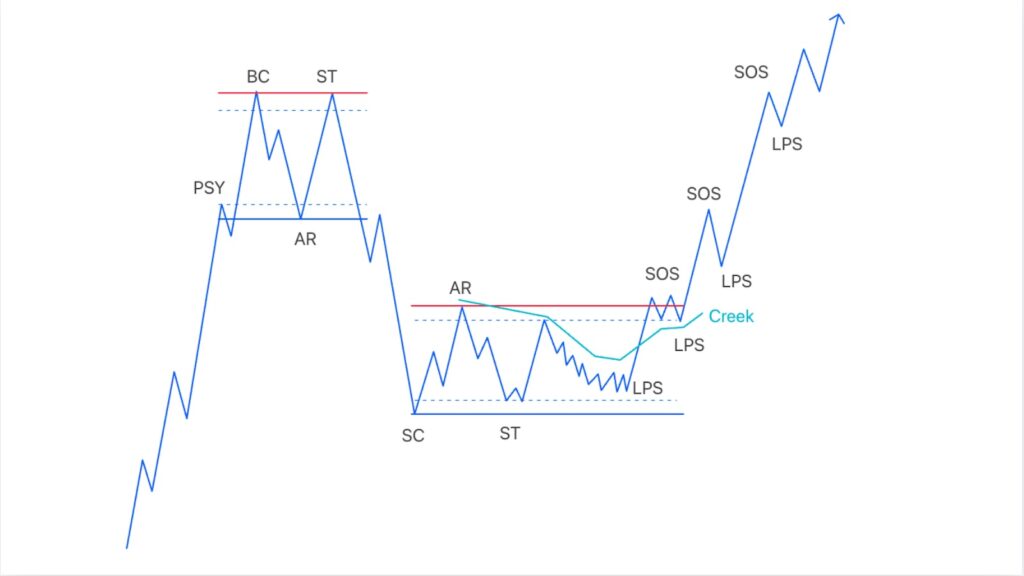 Figure 12: Re-accumulation structure after a decline
The name of this pattern is Reaccumulation after decline. Characteristics:
- It is the weakest form of re-accumulation, because it takes place after a decline that makes investors doubt the next trend.
- The decline usually begins from a small local distribution model, in which the CO feels supply is overwhelming and hard to push up against, so they give up absorbing, causing price to fall out of the TR.
- After that, at cheaper prices, the CO feels supply has weakened and it is an appropriate time to optimize inventory at low cost; the CO carries out a plan to absorb supply, causing price to stop falling and enter an accumulation TR.
Example of Gold on the 2h timeframe with a re-accumulation after weakening structure:
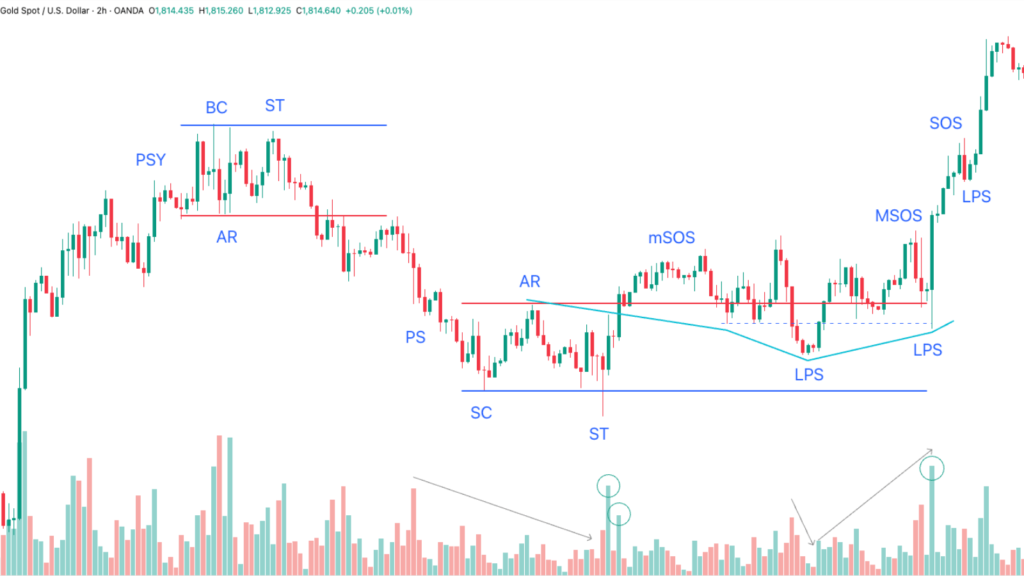 Figure 13: Re-accumulation after weakening - Gold
- This re-accumulation structure consists of two small structures: a local distribution structure and an accumulation with strength.
- The lack of demand could not push price up, causing price to fall out of the first TR.
- At the second TR, volume decreases right at the early stage; demand appears and pushes price to break through the upper boundary (blue circle).
- A small local structure forms at the upper boundary; price cannot touch down to the lower boundary of the TR.
- Price creates the first LPS (which is a shakeout in the local structure) with decreasing range and volume, showing supply exhaustion. After that, price rises to create a second LPS with higher highs and lows.
- Suitable entry points lie at the strong rising candle after the LPSs.
In addition, we also have diagonal TR variations, which will be covered in later parts.
5/5 - (2 votes)
Read structure 10x faster with JUKA
JUKA maps SMC structure — swings, BOS, CHoCH and inducement zones — automatically on any TradingView chart. No more hand-drawing structure for hours.
Get JUKA — $150