ICT Part 11: Judas Swing
What Is a Judas Swing in ICT?
In the ICT method, a Judas Swing is a false move at a specific time, intended to deceive retail traders into believing that price will continue moving in one direction, after which the market reverses and they are trapped.
"Judas" is a word implying "the traitor"; in essence this is Smart Money's act of psychological manipulation of traders.
Characteristics of the ICT Judas Swing
A Judas Swing is not a price pattern but a time-based event, usually appearing at 9:30 AM, 1:30 PM, and after 00:00 AM.
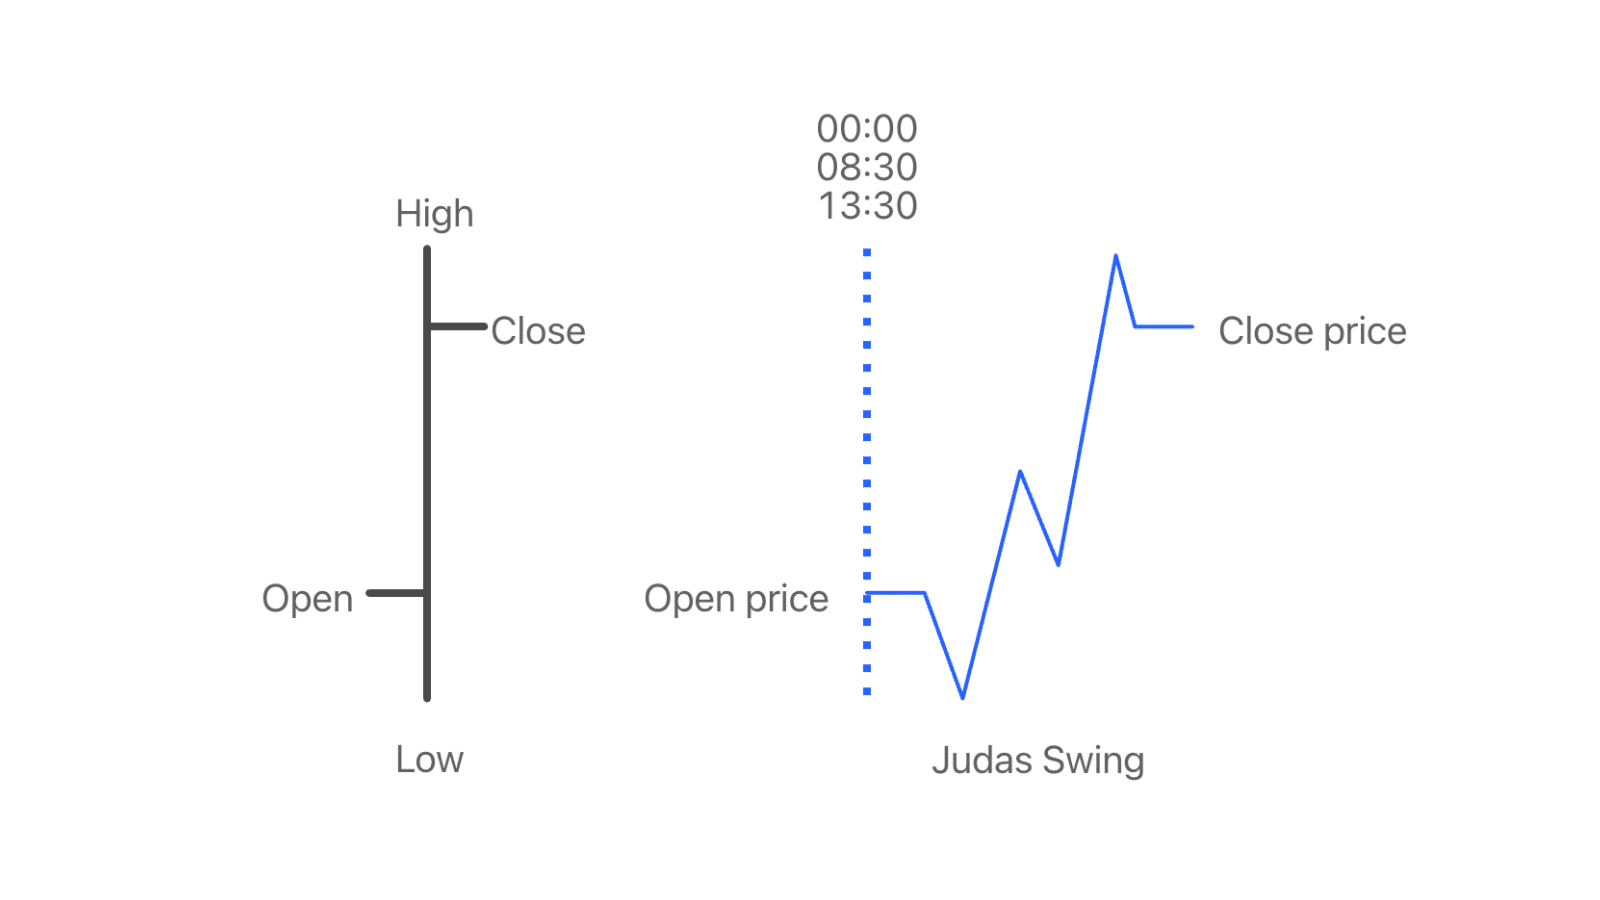 Judas Swing in ICT
In a bullish structure, an ICT Judas Swing is a fast and strong move (displacement) down below the opening price, making retail think price will continue to fall and sell.
Then price comes back up, sweeping all the sellers' stop-losses.
Similarly, in a bearish structure, an ICT Judas Swing is a displacement up above the opening price, making retail think price will move in a bullish direction and buy in.
In reality, that is a price trap; the market will reverse and sweep the stop-losses of the buyers because they trusted that rise.
When a Judas Swing forms, it is basically a move that usually occurs at:
- An important support or resistance level
- A previous high or low
- A counter-trend pullback to form an OTE
- A sweep of the previous week's high or low
- A sweep of the previous session's high or low
- A sweep of intraday highs and lows
How to Trade with the ICT Judas Swing
London Judas Swing
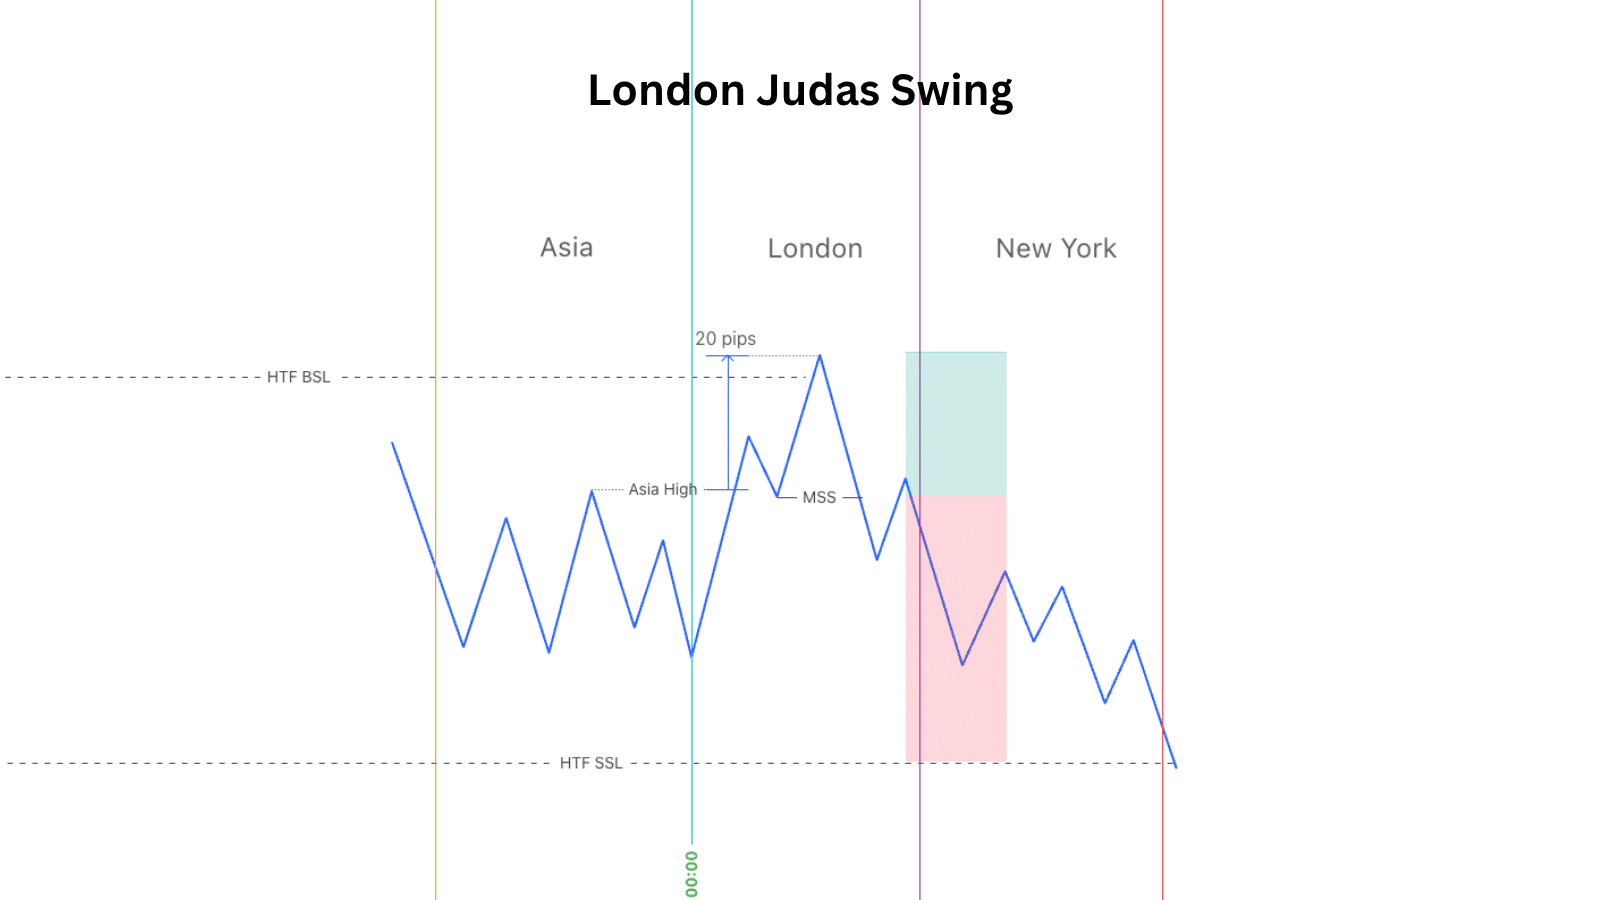 What is a London Judas Swing
If trading after the London session opens, look for the price area where the Asian session moved sideways, and pay attention to the Asian session's stop-loss levels being swept.
After the Midnight Open at 00:00 AM, observe the strong rise/fall that breaks out of the Asian session and draws traders into trades.
Wait for a sweep of the Asian session high/low by about 10–30 pips, after which price reverses to create the London session's high/low of the day.
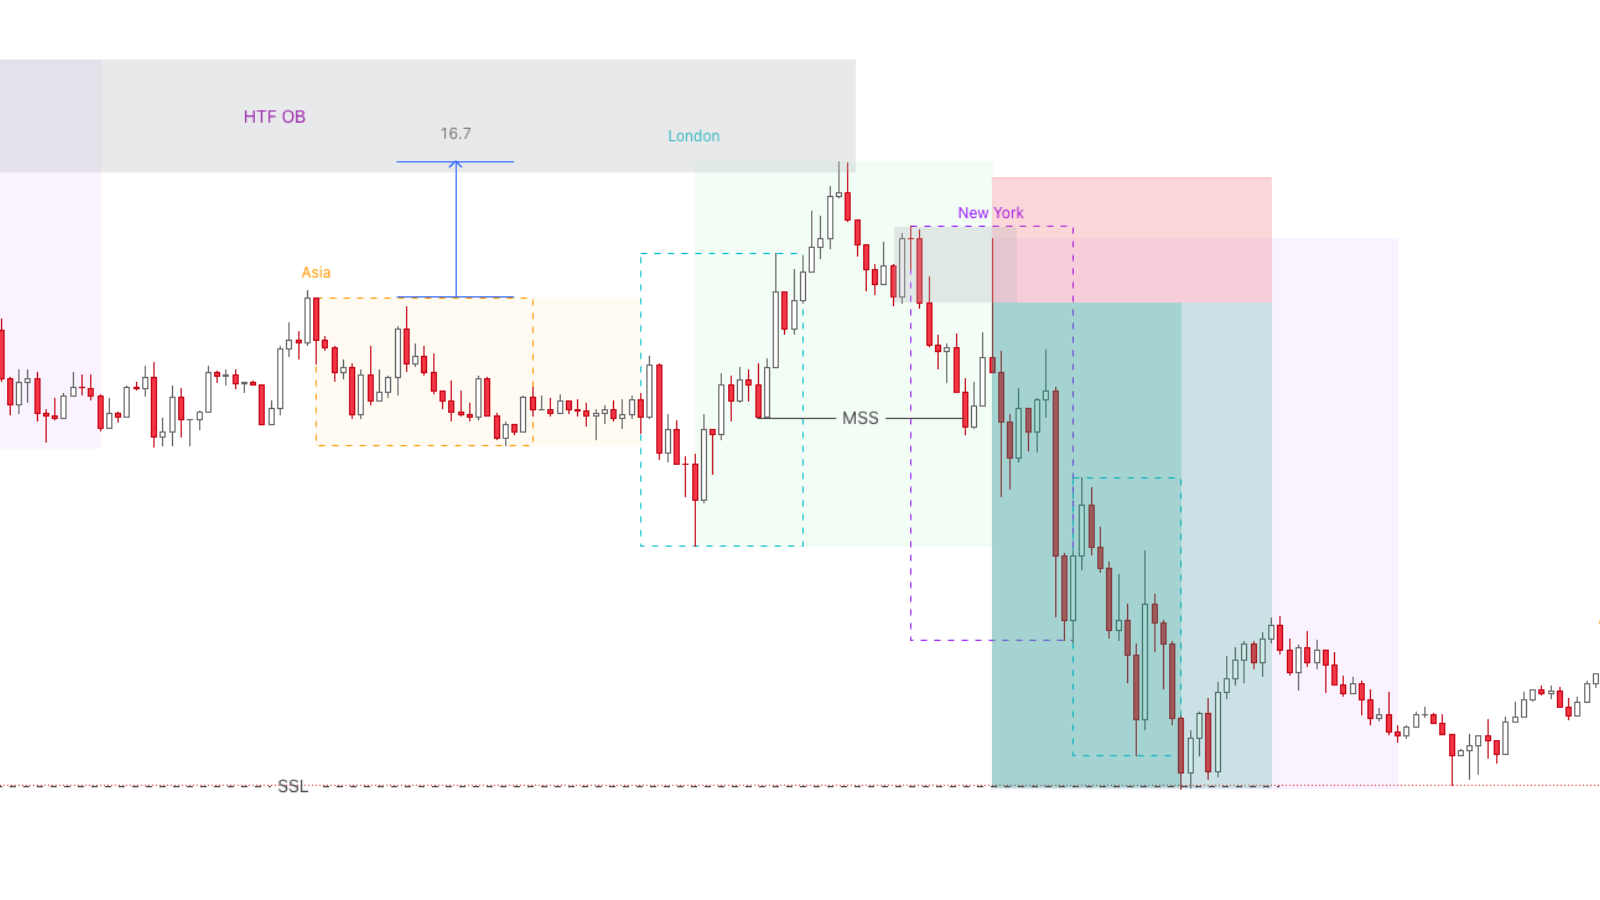 Example of a London session Judas Swing
This setup is equivalent to the Intraday Profile in Part 8: CBDR.
New York Judas Swing
In the New York session, the trading window is from 9:30 – 10:00 AM. This is when the US stock market opens, causing indices and currency pairs to be affected.
First, note that when there is important high-impact news at 8:30 AM, there will be no Judas Swing at 9:30 AM.
After the Midnight Open at 00:00, observe the London session:
- If London reverses, the New York Judas Swing is a continuation.
- If London continues, the New York Judas Swing is a reversal.
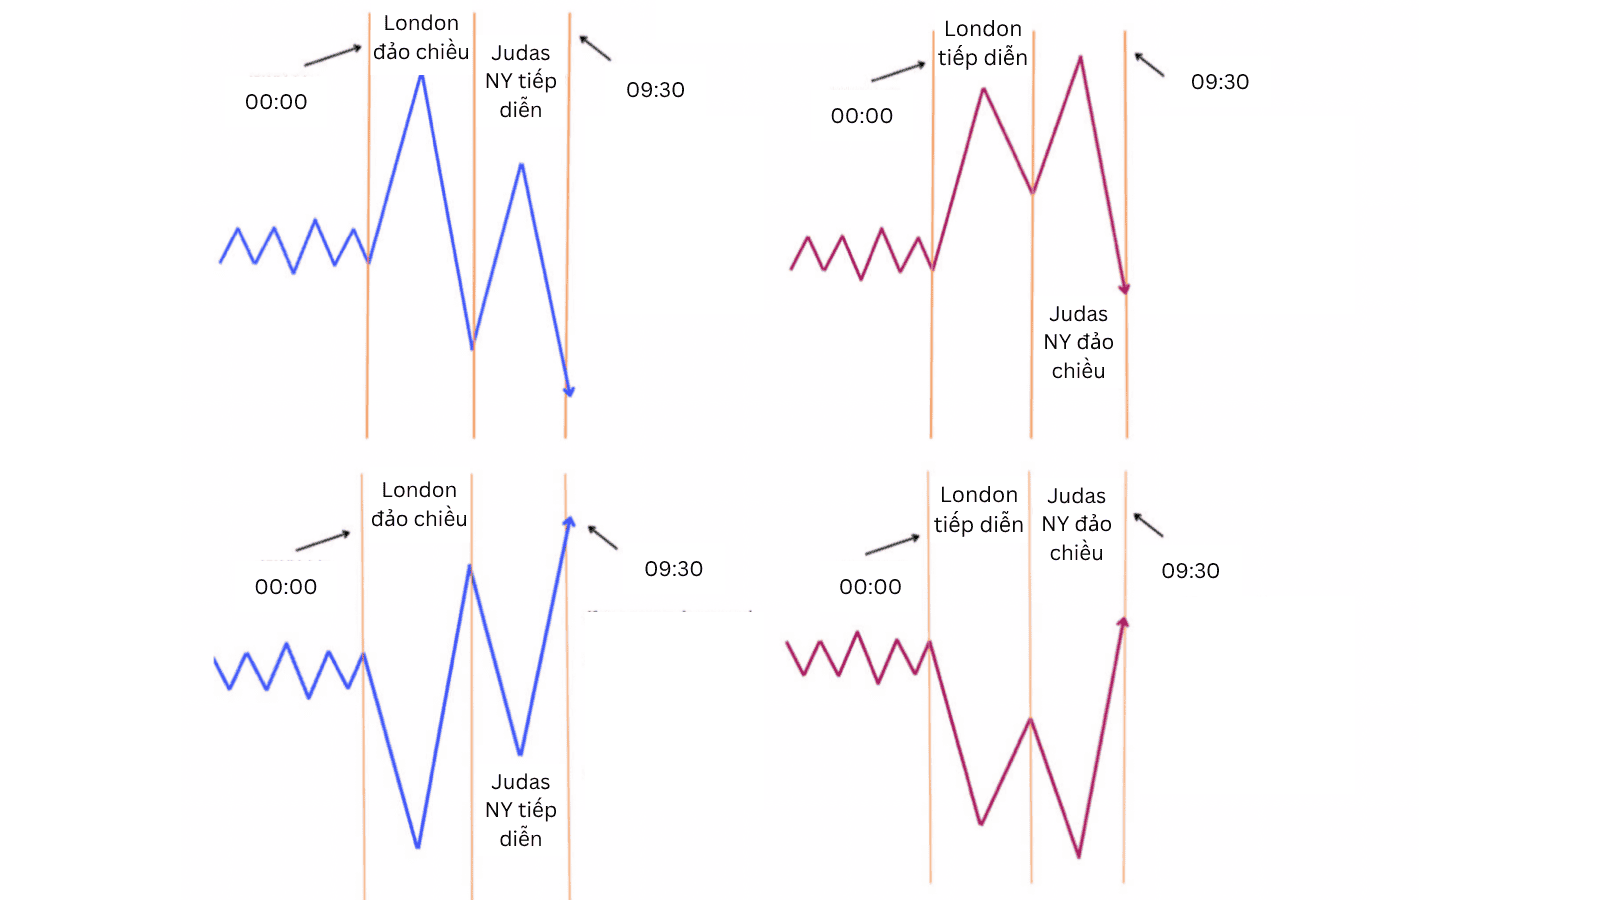 New York Judas Swing diagram
When entering the New York session, based on the timing of the news we have two scenarios to anticipate:
Scenario 1: A Judas Swing occurs at 9:30 AM.
As mentioned earlier, a Judas Swing is a false move, so after liquidity is swept, we want to see price reverse right at that point.
Identify a PD Array to find an entry on the m15 timeframe, then look for BSL/SSL before the index opens at 9:30 AM.
Scenario 2: only applies when there is news released at 10:00 AM.
When news is scheduled for 10:00 AM, we do not expect there to be a Judas Swing at 9:30 AM.
Instead, wait during 10:00 – 10:10 AM for liquidity to be swept, forming a Judas Swing, followed by an immediate reversal.
Usually, our target is the liquidity level in the opposite direction.
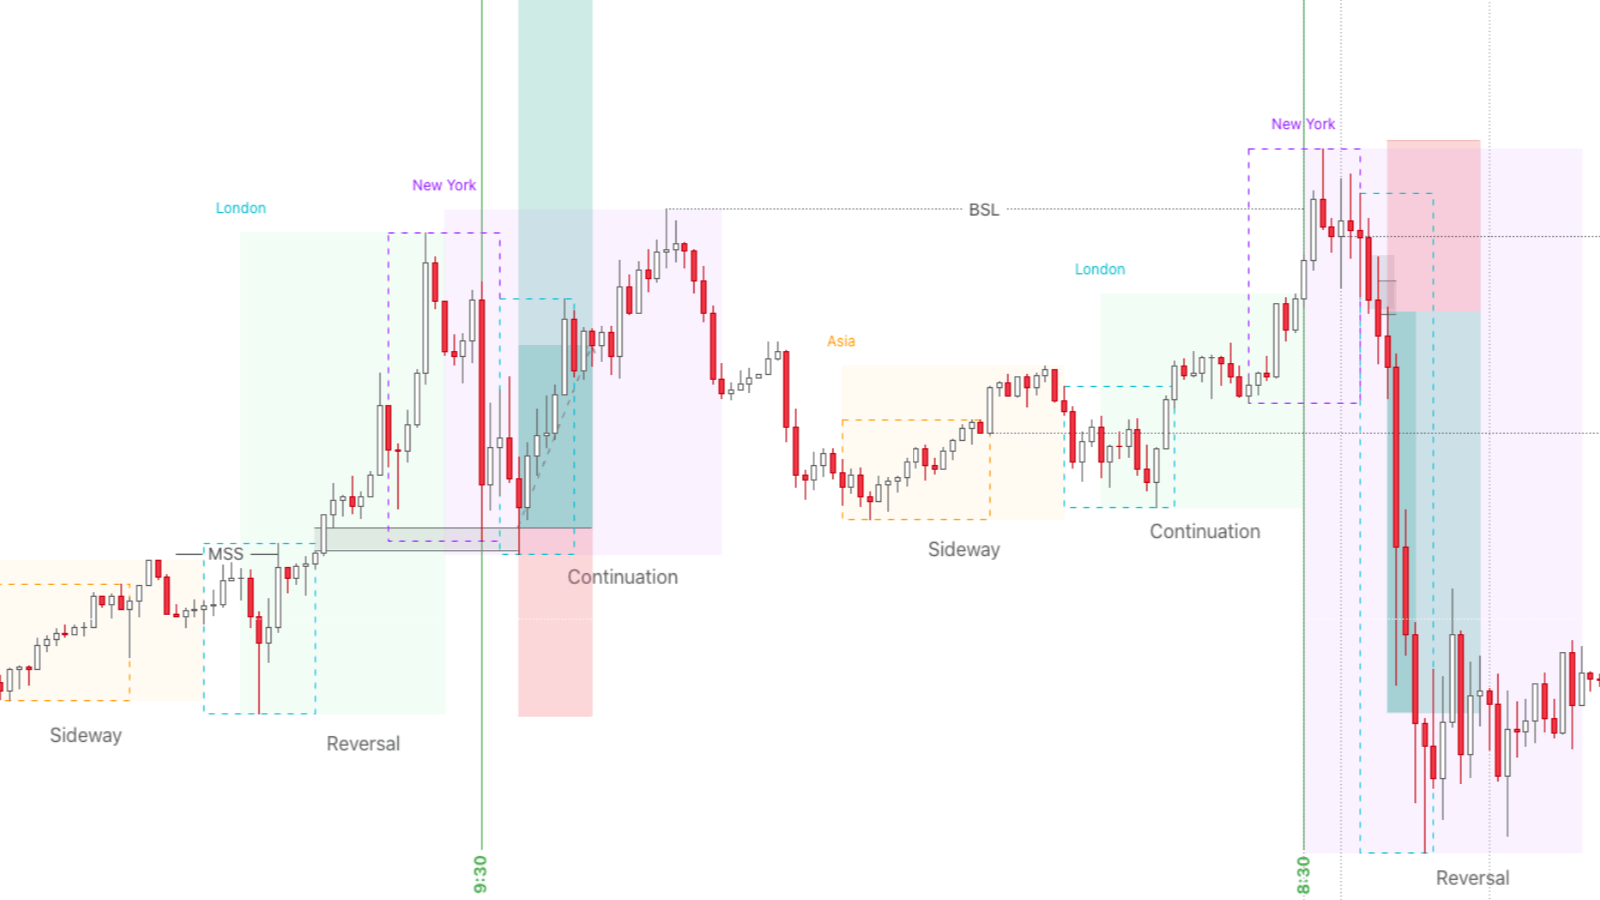 Example of a New York session Judas Swing
In the example above, we have two trading days on the m15 timeframe:
- On the first day, the Asian session moves sideways, the London session reverses and the New York session continues. We wait after 9:30 for manipulation to enter a Long trade.
- On the second day, the Asian session moves sideways, the London session continues, and the US session reverses. Because there was news at 8:30 and price had already taken BSL, we no longer wait for a Judas Swing at 9:30. Instead, we drop to m1 to find an entry.
1:30 Judas Swing
1:30 PM is an important time marker, usually coinciding with manipulation moves and the reversal phase in the New York session.
At the 1:30 time point, we will wait for certain conditions relating to the morning session (AM session), the 1:30 opening price, MSS, displacement, and so on.
All of the theory and examples of the 1:30 Judas are in the ICT 2023 PDF that Trading Hub 3.0 has compiled. Download the PDF in the documents section.
Read structure 10x faster with JUKA
JUKA maps SMC structure — swings, BOS, CHoCH and inducement zones — automatically on any TradingView chart. No more hand-drawing structure for hours.
Get JUKA — $150