ICT Part 9: Advanced Market Structure
What Is Market Structure in ICT?
Market Structure in ICT is the framework of price movement over a given period, reflecting the market's behaviour and order flow.
Smart Money does not view Market Structure the way retail does. They view price based on liquidity and imbalance.
Market structure is formed through swing highs and swing lows, helping traders identify the overall trend:
- Sideways Market Structure: price ranges within a range, creating equal highs and lows.
- Bullish Market Structure: price continuously creates Higher Highs and Higher Lows.
- Bearish Market Structure: price continuously creates Lower Highs and Lower Lows.
The market trades according to a common pattern or rhythm, and it is very easy to read if you understand the basic structure that price tends to move in.
Components of Market Structure
What Is a Short Term High/Low?
STH: A Short Term High is a short-term high, formed by a cluster of 3 candles in which the high of the middle candle is higher than the highs of the candles on the left and right.
STL: A Short Term Low is a short-term low, formed by a cluster of 3 candles in which the low of the middle candle is lower than the lows of the candles on the left and right.
 What is a short term high/low?
What Is an Intermediate Term High/Low?
ITH: An Intermediate Term High is an intermediate-term high; any STH that has two lower STHs on either side becomes an ITH.
ITL: An Intermediate Term Low is an intermediate-term low; any STL that has two higher STLs on either side becomes an ITL.
If you have a bearish bias and an ITH is broken, you need to stop and not enter any more trades.
Similarly, if you have a bullish bias and an ITL is broken, be patient and wait for another setup.
 What is an intermediate term high/low?
What Is a Long Term High/Low?
LTH: A Long Term High is a long-term high, formed when it lies between two ITHs and is higher than both of those ITHs.
LTL: A Long Term Low is a long-term low, formed when it lies between two ITLs and is lower than both of those ITLs.
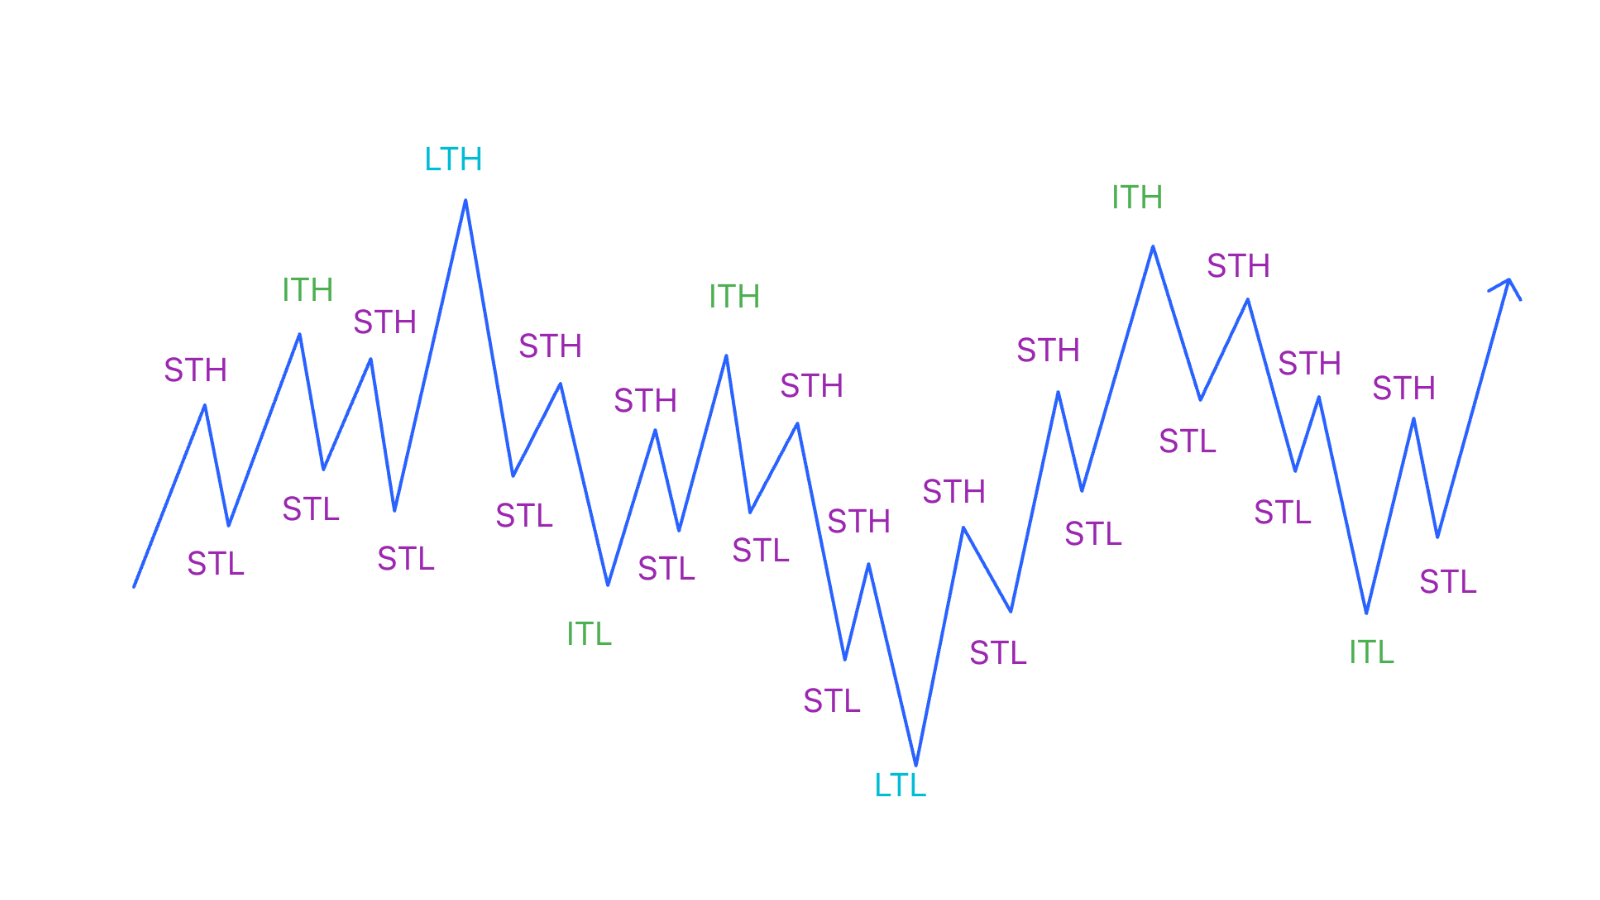 What is a long term high/low?
Important note:
- A highest high formed after interacting with an HTF PDA (such as BSL) is also considered an LTH without needing to lie between two lower ITHs.
- Similarly, a lowest low formed after interacting with an HTF PDA (such as SSL) is also considered an LTH without needing to lie between two higher ITLs.
 LTH forms when price grabs HTF BSL
What Is a Rebalanced ITH?
Whenever price rises to rebalance an Imbalance area (FVG), it will form a Swing High, which is an ITH without needing to lie between two lower STHs.
→ We call that a Rebalanced ITH.
The formation of a Rebalanced ITH shows that the market is very weak; this is when the market reveals its intentions to Smart Money.
Following a Rebalanced ITH is a Failure Swing — a swing that fails to break that ITH, leaving behind Order Flow/Order Block.
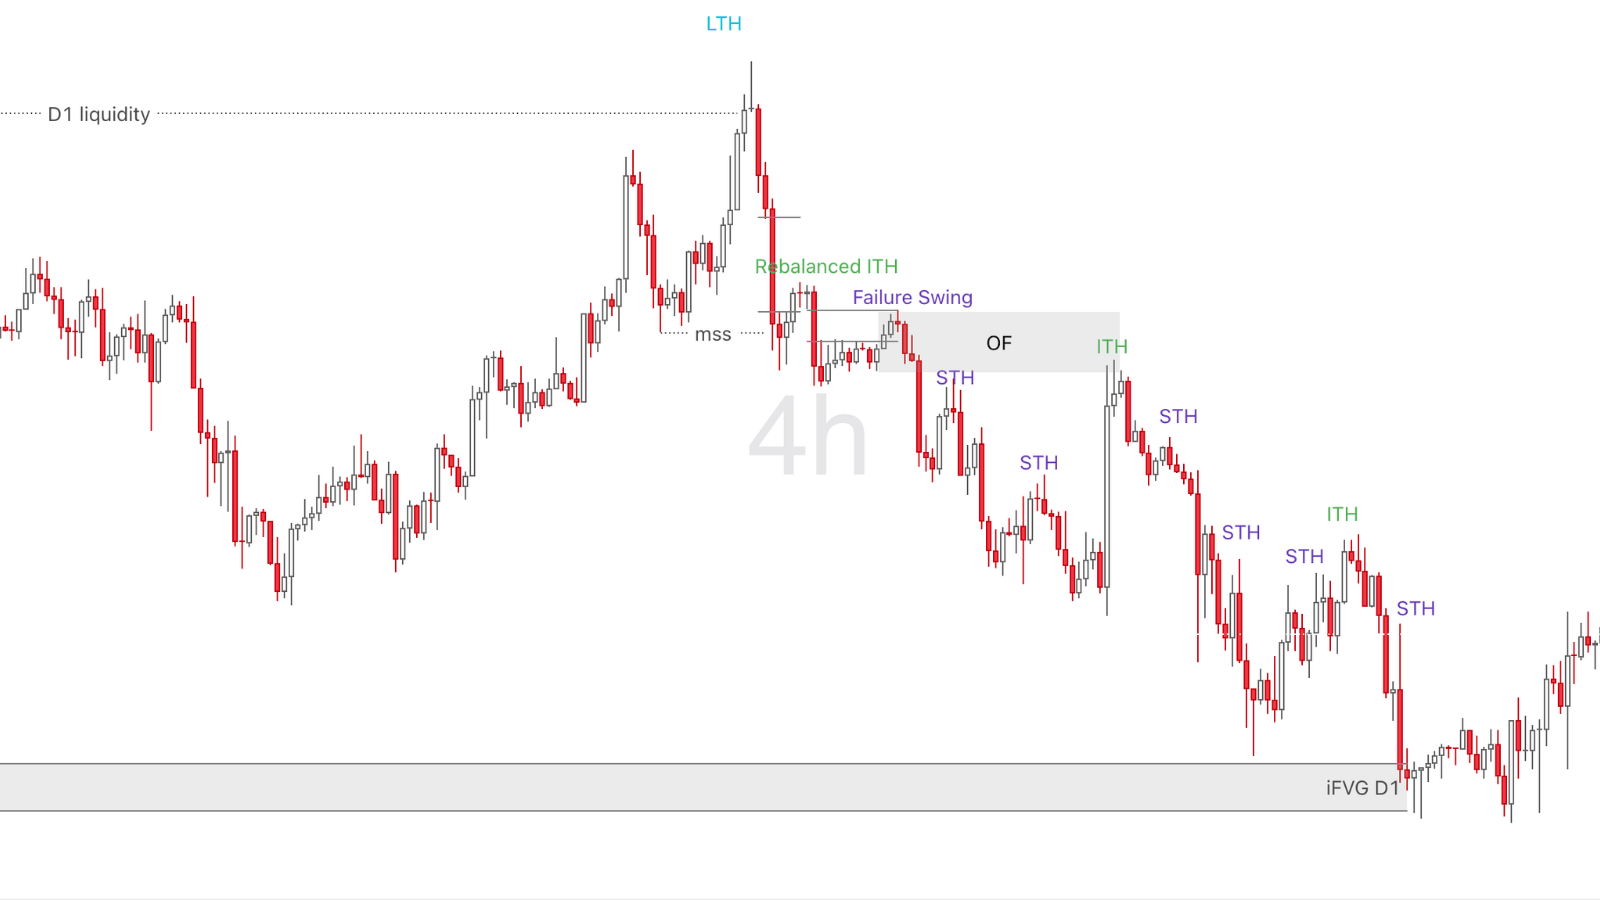 An STH tapping an FVG becomes a Rebalanced ITH
If an ITH is broken, our analysis may not be accurate.
If you encounter such a situation, do not try to trade; wait for the market to reshape its structure.
Similarly, if price drops to rebalance an Imbalance area, it will become a Rebalanced ITL. Following that is a Failure Swing that fails to break that ITL.
How Market Structure Forms
Usually, price moves from an STL up to an STH and then turns back to form a new STL.
As these STLs and STHs form, they will develop into a “market structure”.
Sideways Structure
In a sideways market structure, price ranges within a defined range, with equal (or nearly equal) highs and lows, creating EQH/EQL at the upper and lower boundaries.
- When price moves from the lower boundary to the upper boundary, we have a bullish structure on a lower timeframe.
- When price moves from the upper boundary down to the lower boundary, we have a bearish structure on a lower timeframe.
 Sideways Market Structure
The sideways phase is the premise for the manipulation and accumulation phase, which we will learn about in the three phases of the market — AMD.
Bullish Structure
In a bullish structure, price will create higher LTHs and higher LTLs.
If price is expected to go higher, it needs to respect the recent LTL. If price breaks the LTL, the market will no longer be bullish.
Suppose when you see price rise to an important liquidity level on the HTF, followed by a decline, it may be a pullback or a reversal depending on whether price has taken IRL or ERL liquidity on the HTF.
Bearish Structure
In a bearish structure, price will create lower LTLs and lower LTHs.
If price is expected to go lower, it must not break the recent LTH. If that happens, the market will no longer be bearish.
When price drops to an important liquidity level on the HTF, there will be a rise, which is a temporary pullback or a reversal depending on whether price has taken IRL or ERL liquidity on the HTF.
To identify important liquidity levels, you need to use PD Arrays on the HTF timeframe.
Without HTF liquidity levels, you cannot have a bias regardless of which trading model you are using.
How to Trade with Market Structure
Whether or not we can identify LTHs/LTLs will depend greatly on the timeframe chosen.
Choosing a Timeframe
Your main goal is to know clearly the timeframe you are trading. This depends on the type of trader you want to become.
You will see 3 timeframes for each type of trader:
- HTF (High Time Frame): provides trading ideas based on a larger timeframe, determines bias and manages trades.
- ITF (Intermediate Time Frame): the intermediate timeframe for managing your trades.
- LTF (Low Time Frame): the short timeframe, used to time entries and find early reversal signals, thereby knowing when to take profit.
Position trader
HTF: Monthly
ITF: Weekly
LTF: Daily
Swing trader
HTF: Daily
ITF: 4h
LTF: 1h
Short-term trader
HTF: 4h
ITF: 1h
LTF: 15m
Intraday trader (Day trader)
HTF: 1h
ITF: 15m
LTF: 5m
The lower we go in timeframe, the more detail of the overall picture we can see.
In an uptrend, when looking at the HTF we will see highs and lows rising — HH, HL.
And when we drop to the ITF, we will clearly see ITLs and ITHs rising.
Dropping to the lowest timeframe, the LTF, we will see in detail LTLs and LTHs rising.
Analysis Steps
First, you need to study market structure from a long-term/intermediate-term perspective.
Then, the short-term perspective will provide entry signals based on what you have analysed.
The highest-probability trades will be found by following the long/intermediate-term perspective.
Example of entering a trade with market structure across timeframes on EU:
 Market Structure on the Daily timeframe
On the HTF Daily chart, price is in an uptrend, then pulls back to a Discount Array containing an FVG and an OB.
This OB is a high-probability OB because it has an FVG above it.
Here price taps IRL liquidity, and the next target is for price to go up and take ERL liquidity.
Drop to the LTF to confirm the entry.
 Market Structure on H1
On the H1 chart, when price touches the Daily OB it immediately reverses, creating a potential LTL.
We need price to respect this LTL; otherwise all of our analysis will be wrong.
Price moves up creating ITLs, while respecting an H1 Liquidity Void lying inside the Discount Array.
Displacement appears, breaking structure (BOS), continuing to create ITLs and respecting the H1 Liquidity Void.
At this point we mark a second LTL higher than the first LTL → Bullish Market Structure.
The problem here is that we can only mark the second LTL after the ITL to its right appears, by which time we may have missed the trade.
The key is to anticipate a bullish bias based on the factors:
- On the LTF, price violates an ITL but creates a second LTL and respects the first LTL. In essence, on the ITF H4, price creates rising ITLs, meaning the uptrend is still continuing.
- Displacement breaks structure (BOS).
- Price respects the H4 FVG (in confluence with the H1 LV).
- From that, it shows Smart Money wants to push price up, and we anticipate price will respect the LV created after that Displacement phase.
→ A Buy order can be placed as a limit at the LV after price pushes up from an STH creating Displacement.
Note that on the LTF, even if the second LTL has not yet appeared, if the market creates rising ITHs/ITLs and respects FVGs, we can still go long at PDA areas such as FVG/OB/OF created after an STH forms to its right.
Read structure 10x faster with JUKA
JUKA maps SMC structure — swings, BOS, CHoCH and inducement zones — automatically on any TradingView chart. No more hand-drawing structure for hours.
Get JUKA — $150