Lesson 6: Elliott Diagonal Waves (Ending & Leading Diagonal): When an Impulse Wave Breaks the Rules
The Elliott Diagonal Wave is the only exception in the entire impulse wave system of Elliott Wave theory, carrying with it the sign of a market trend reversal.
What is an Elliott Diagonal Wave? Why is it called a "rule-breaking" impulse wave
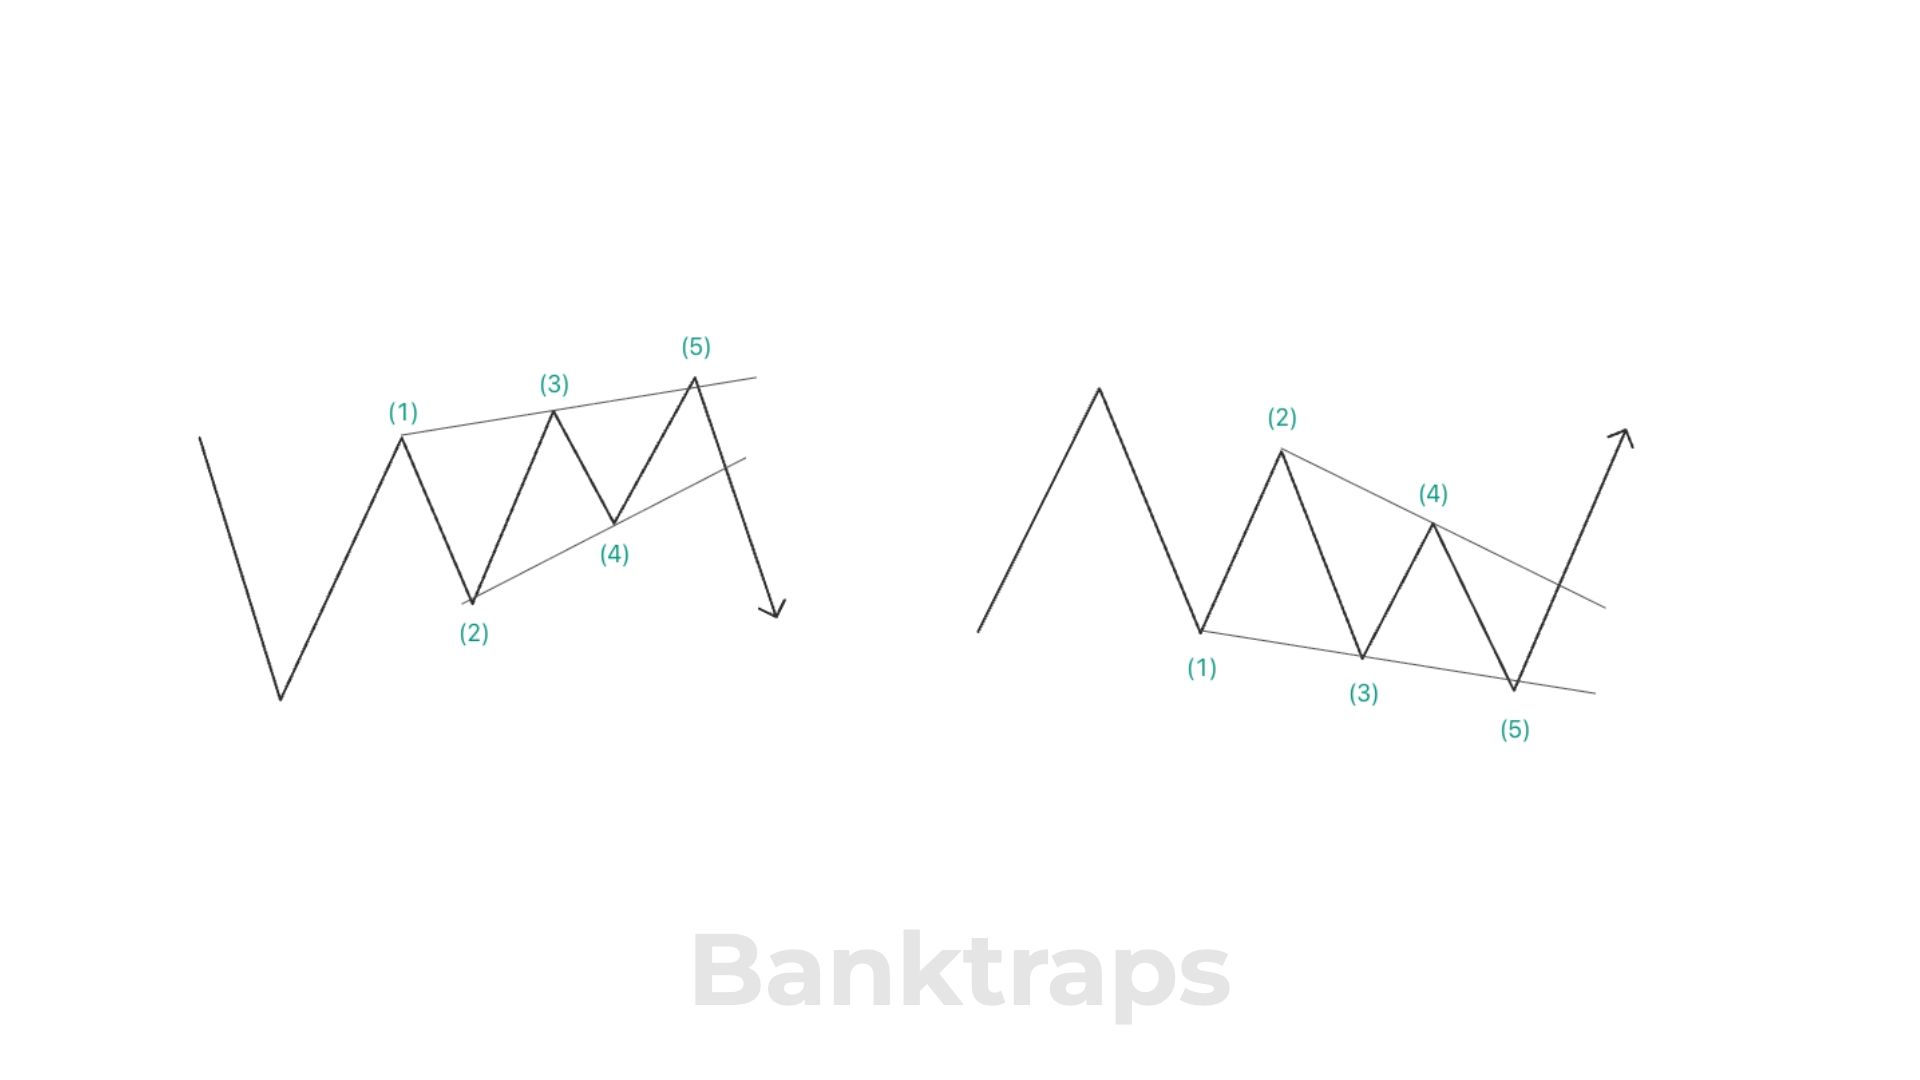 Figure 1: The Elliott Diagonal Wave is a special type of impulse wave consisting of 5 waves
The Elliott Diagonal Wave is a type of motive wave consisting of 5 waves but not a pure impulse. This pattern still retains the two original characteristics of a motive wave: no corrective sub-wave retraces the preceding wave completely, and wave three is never the shortest wave among the three motive sub-waves.
The difference lies in this: This is the only 5-wave structure in the direction of the main trend that is allowed to let wave four enter the price territory of wave one, a phenomenon called overlap. The article on the overlap rule in impulse waves established that this is absolutely not to be violated in a pure impulse. The Diagonal is precisely the exception, and this exception is not a wave-counting error, but a pattern in its own right with an entirely different market meaning.
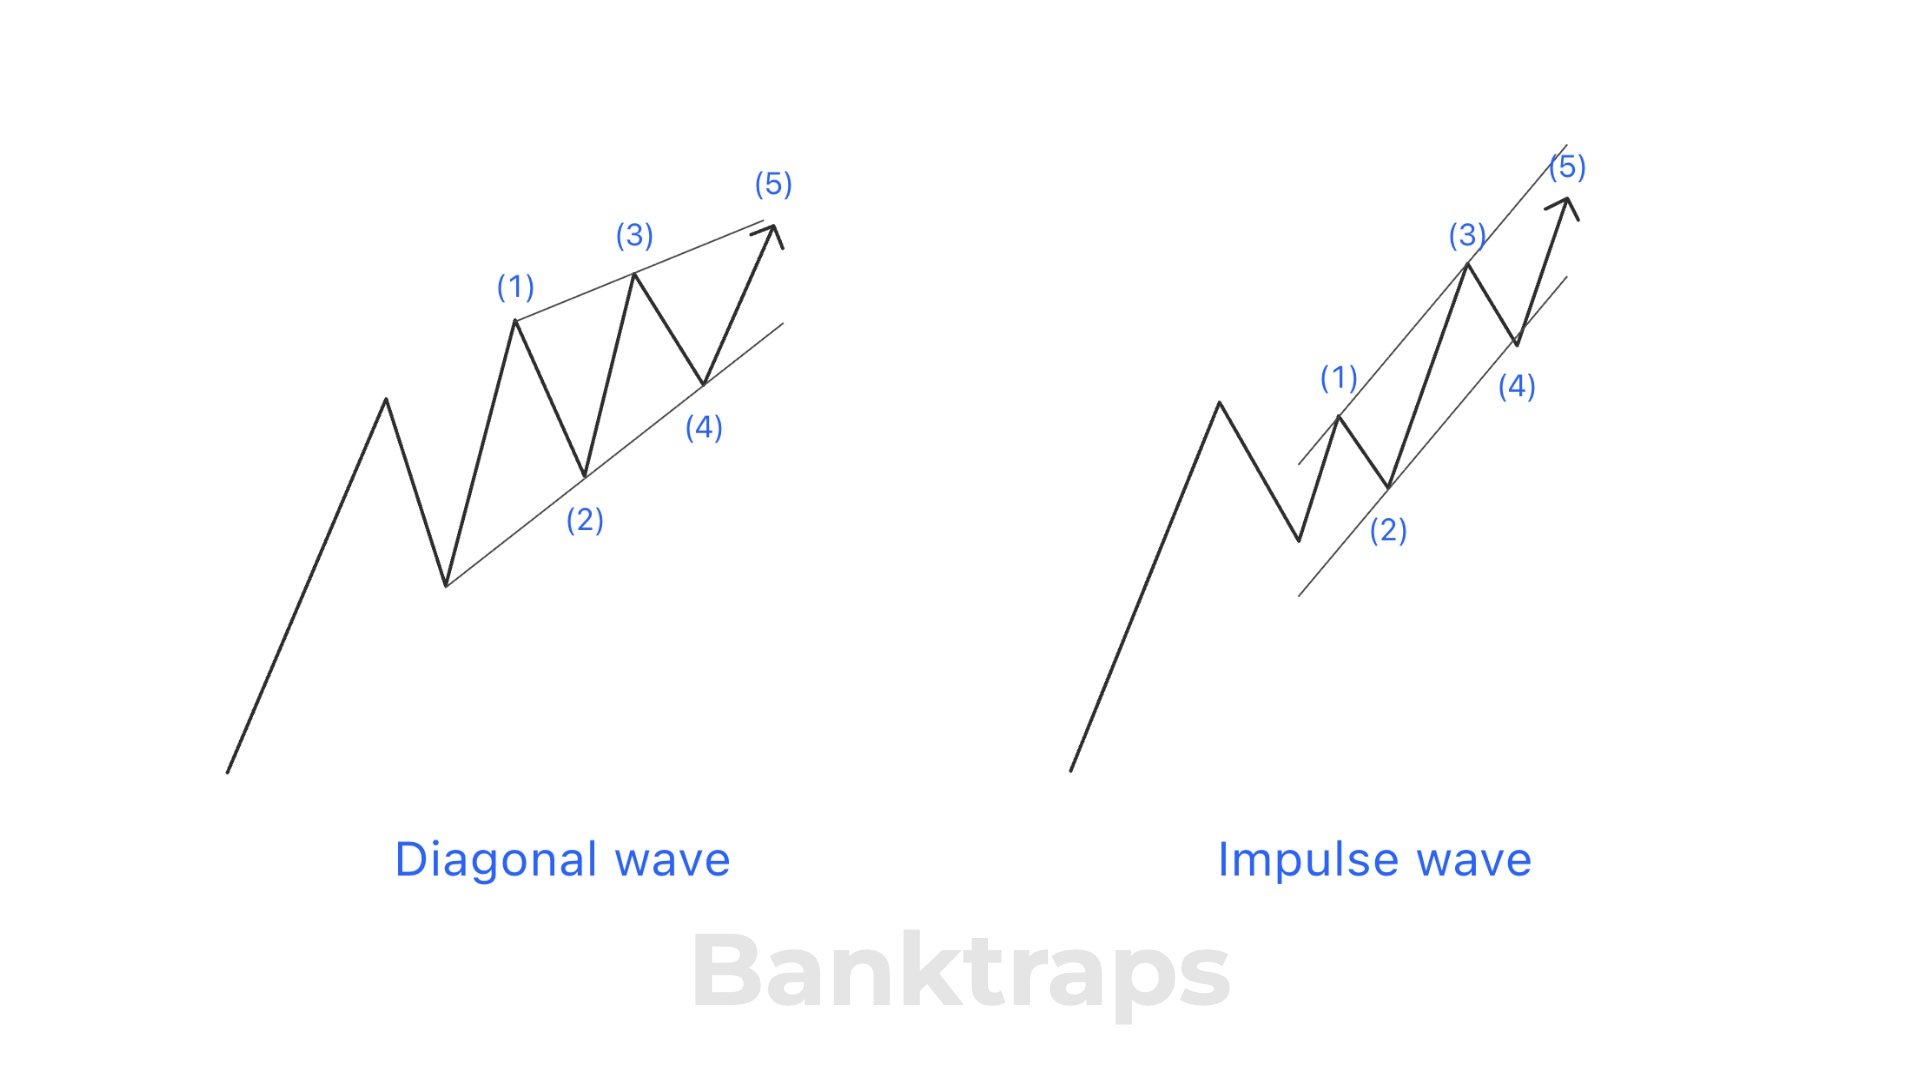 Figure 2: The Elliott Diagonal Wave has 2 converging trendlines instead of parallel ones like an Impulse
Because wave 4 intrudes into the price territory of wave 1, the two boundary lines connecting the tops and bottoms of a Diagonal are no longer parallel like a normal impulse price channel. They converge toward each other, forming a wedge shape (or a diagonal triangle shape; some sources call this the Elliott diagonal triangle wave), which is the fastest visual identification sign on a chart.
Where Diagonals Appear in the Elliott Wave Structure
Diagonal waves appear in only two fixed positions in the entire Elliott wave system:
- The first position is wave five of an impulse sequence, or wave C of a zigzag/complex sequence, in which case it is called an Ending Diagonal.
- The second position is wave one of an impulse sequence, or wave A of a zigzag sequence, in which case it is called a Leading Diagonal.
These two positions determine the entire meaning of the pattern. The Ending Diagonal stands at the end of a wave sequence, so it carries a message of ending. The Leading Diagonal stands at the start of a wave sequence, so it carries a message of starting.
What Is the Ending Diagonal Pattern in Elliott?
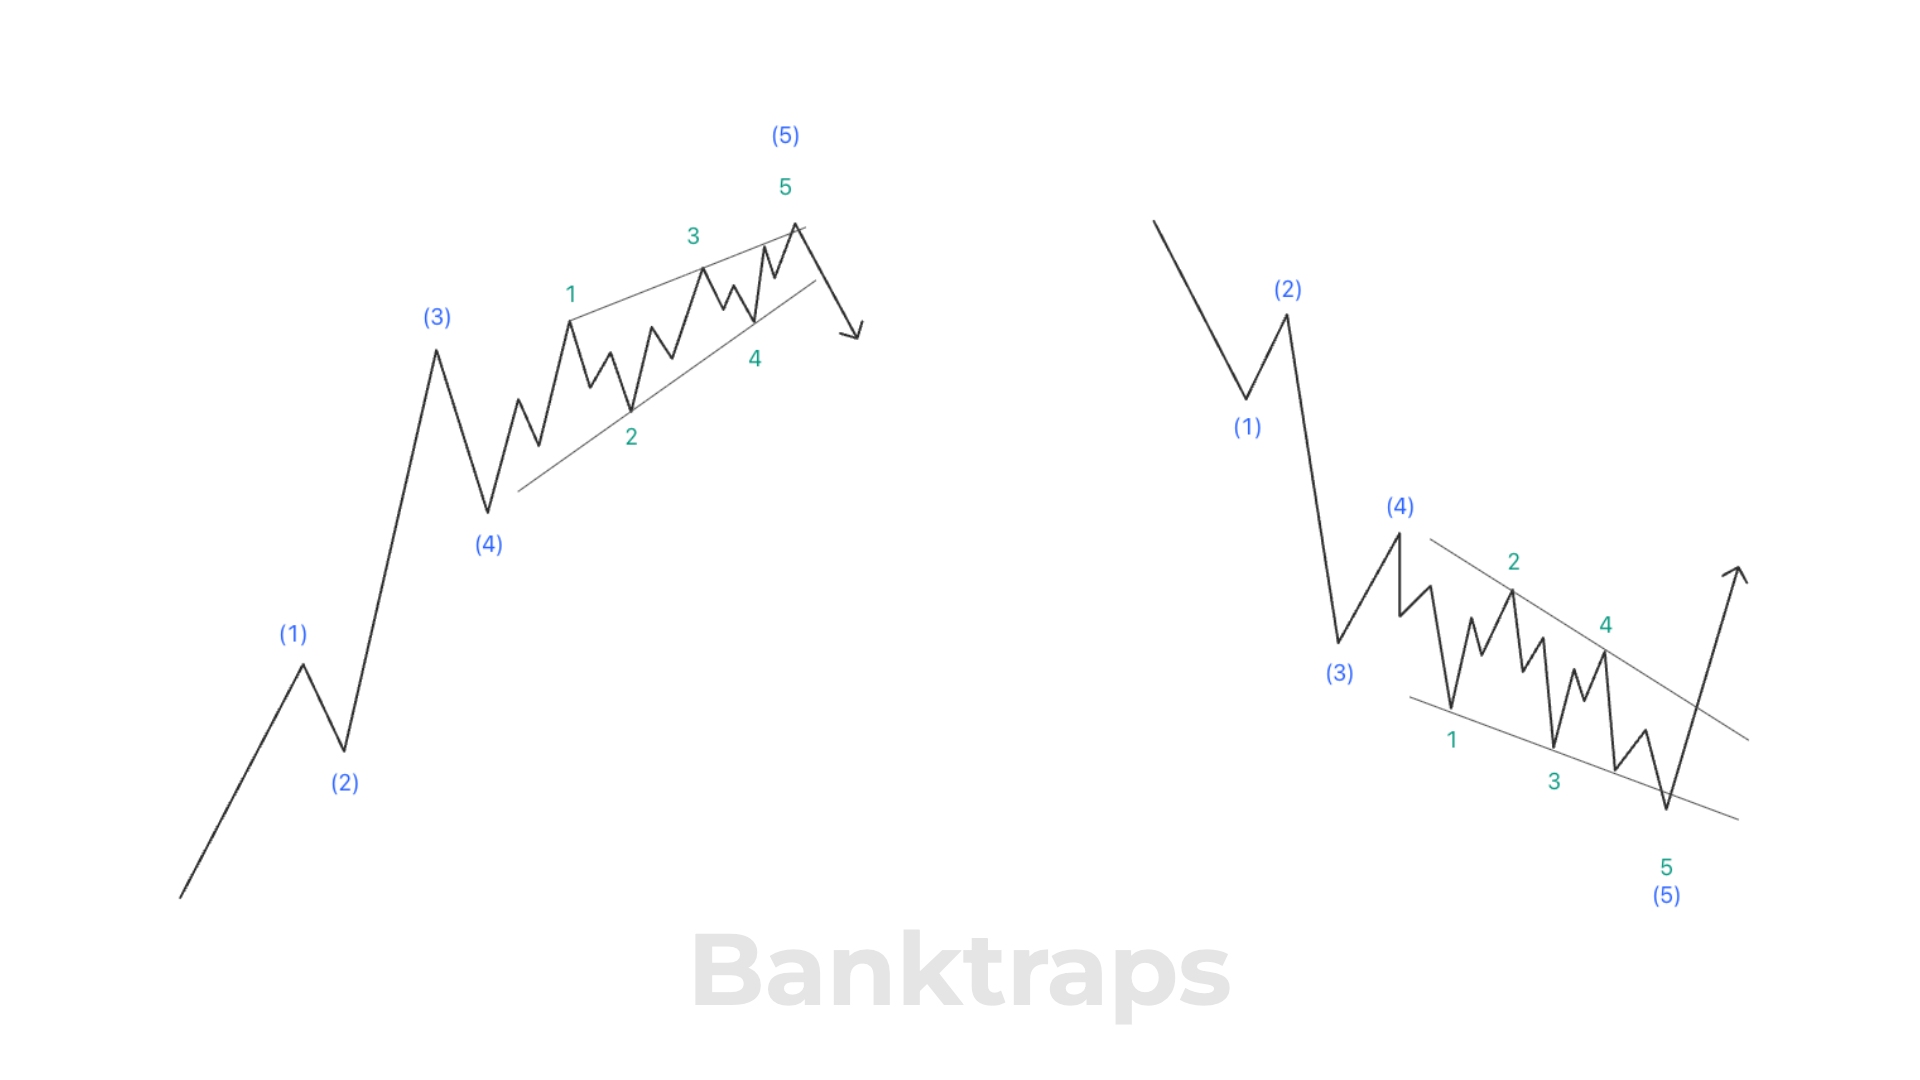 Figure 3: The Ending Diagonal in uptrends and downtrends
The Ending Diagonal is the ending diagonal wave pattern, appearing mainly in the wave five position, at a time when the preceding trend has gone too far too fast. Elliott noted that a very small proportion of ending diagonals appear in wave C of an A-B-C structure. In a double three or triple three corrective pattern, the ending diagonal appears only in the final wave C of the sequence.
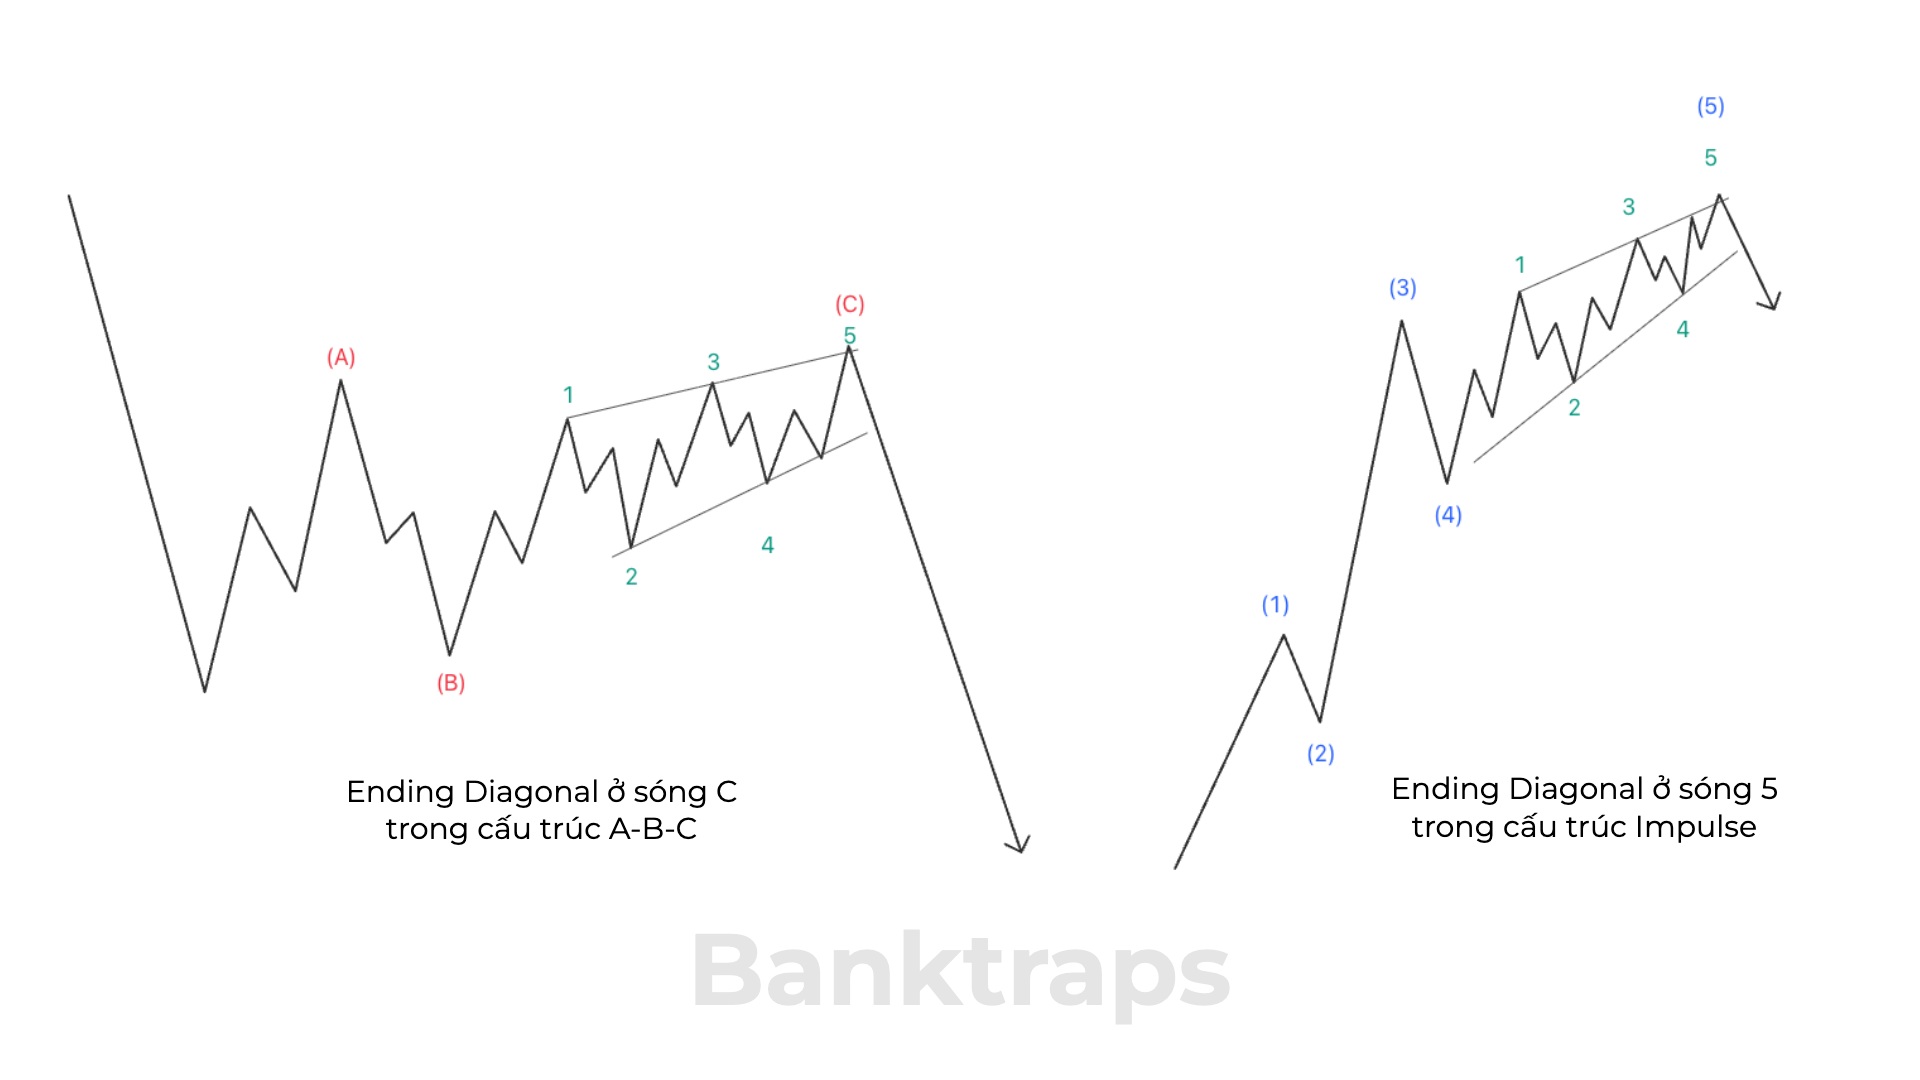 Figure 4: Position of the Ending Diagonal in A-B-C and Impulse structures
The common point in every case is the ending position. The pattern always lies at the termination point of a larger wave structure, signaling that the larger trend has run out of thrust.
Structure of the Ending Diagonal
Inside an Ending Diagonal, all three motive sub-waves 1, 3 and 5 subdivide into "three-wave" form, which is a characteristic specific to corrective waves rather than normal motive waves. As a result, the entire pattern carries a sub-structure of 3-3-3-3-3, entirely different from the 5-3-5-3-5 of a standard impulse.
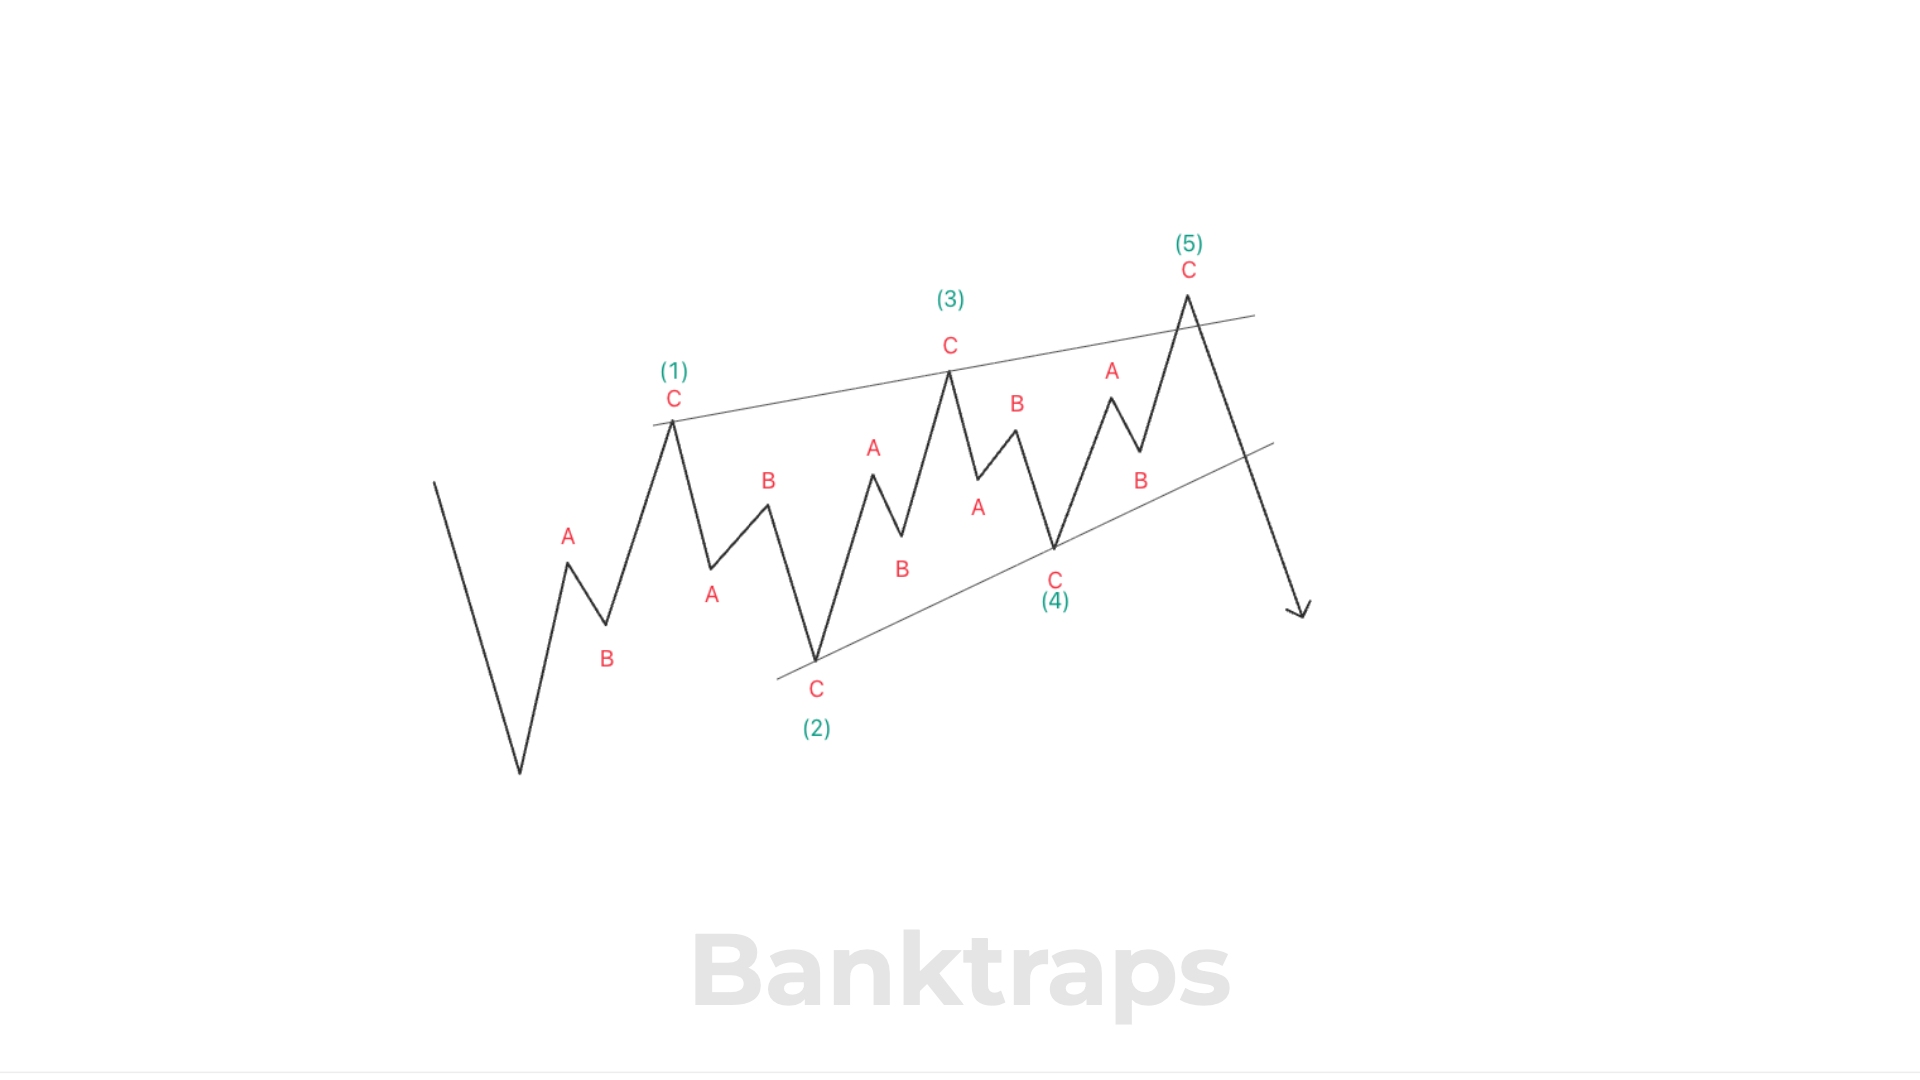 Figure 5: The Ending Diagonal consists of 5 waves, each wave subdividing into 3 sub-waves
What Does an Ending Diagonal Forecast?
The sub-waves inside an ending diagonal have a 3-wave corrective structure, which is a sign forecasting the end of the trend:
- An upward Ending Diagonal is bearish, usually pulling in a sharp decline that retraces back to the price area where the pattern originated.
- A downward Ending Diagonal is bullish, usually opening up a sharp advance up to the price area where the pattern originated.
Just like a wave 3 extension (Extension3) and a truncated wave 5, the ending diagonal conveys the same message: a violent reversal is about to occur. The article on the truncated wave 5 analyzed the first two phenomena. Sometimes all three of these signals appear at the same time at different wave degrees, making the intensity of the reversal of the next wave even stronger.
Elliott Wave International also regards this as one of the most noteworthy signals in the entire system: as soon as an ending diagonal is correctly identified, the analyst should prepare for a reversal that unfolds quickly and decisively.
Throw-over — the sign identifying the end point of wave 5
Throw-over is the phenomenon in which:
- Wave five briefly breaks through the trendline connecting the top of wave one and the top of wave three, right before price reverses.
- Trading volume tends to gradually decrease throughout the formation of the Diagonal, but surges exactly when the throw-over occurs.
This is a much more reliable confirmation signal than merely counting a full 5 sub-waves on the chart. In some rare cases, wave five does not reach the upper trendline, ending short just below the boundary, in which case the subsequent reversal is usually stronger than normal.
Trading application: When you suspect an Ending Diagonal is forming, the first thing to do is wait for the throw-over to complete, that is, for price to briefly break the trendline connecting the top of wave one and the top of wave three and then immediately reverse.
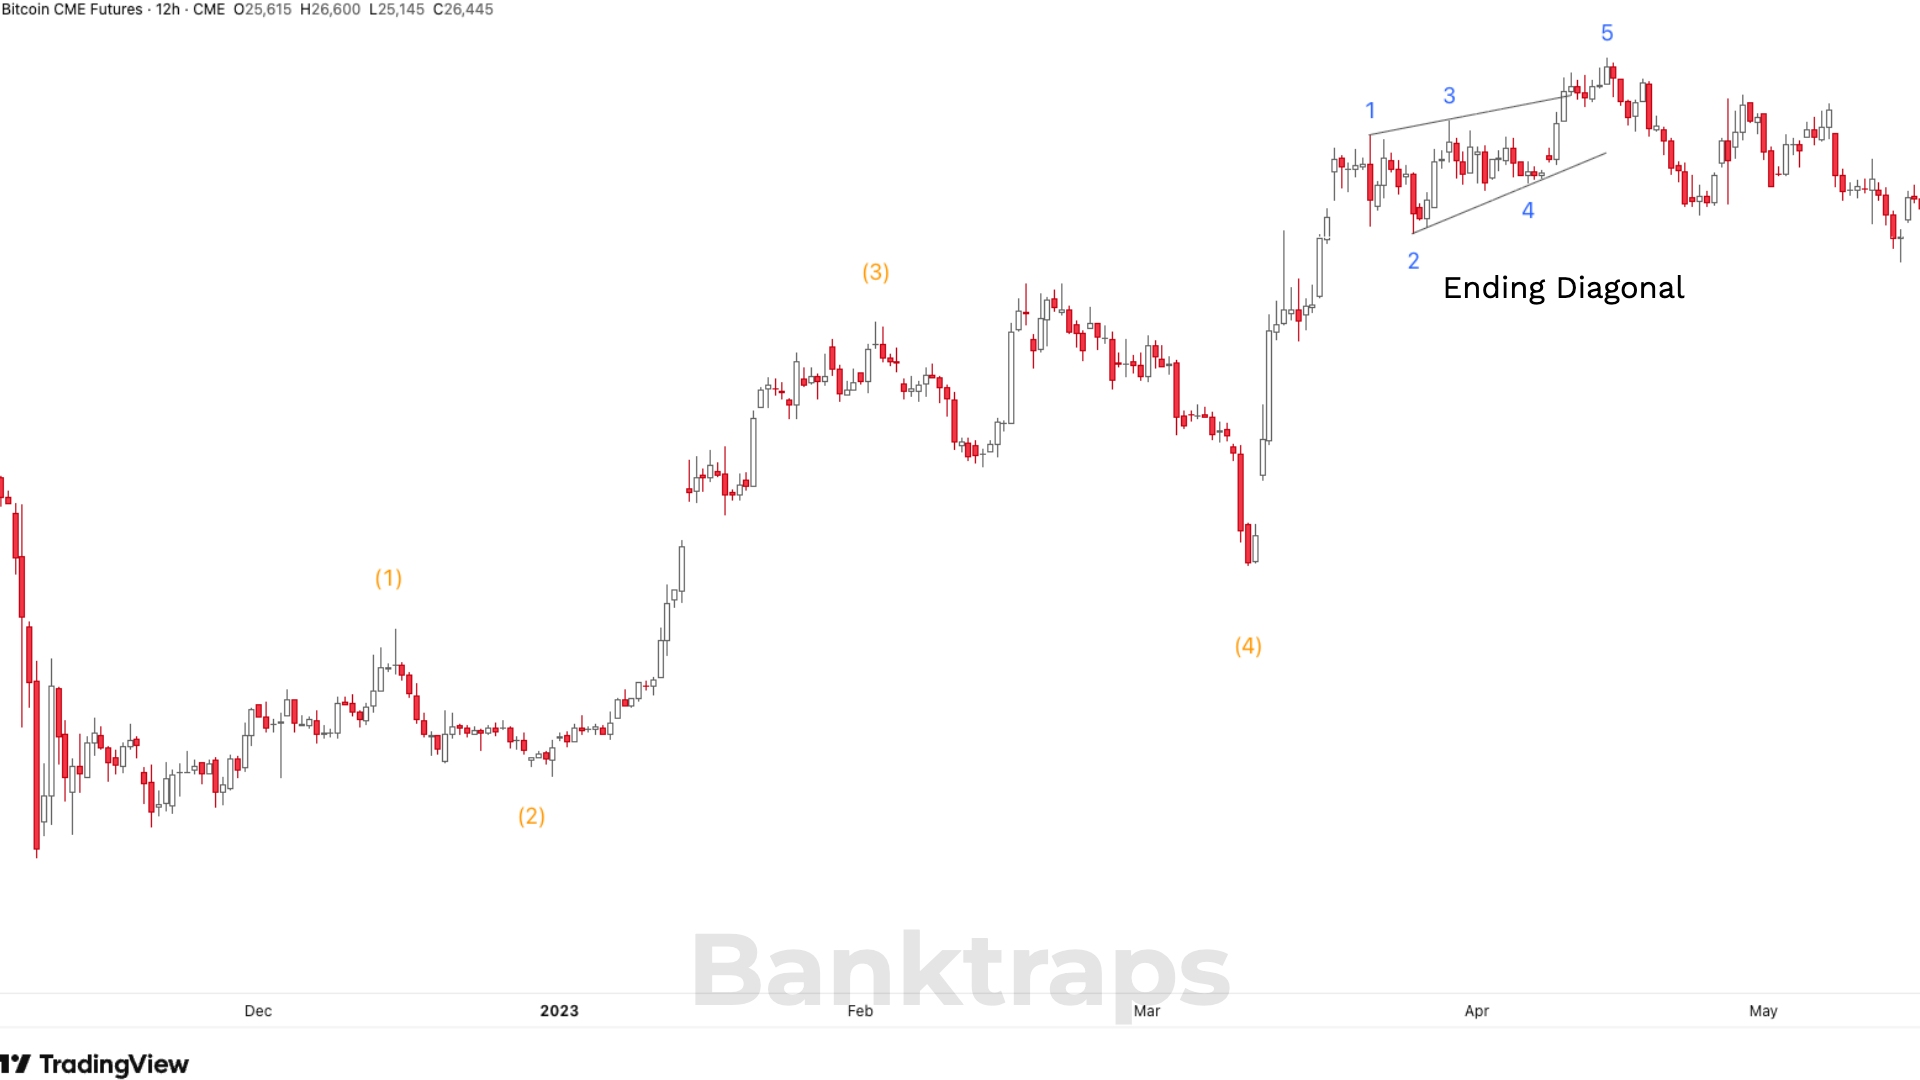 Figure 6: Wave 5 exceeding the trendline in an ending diagonal forecasts a bearish move
A cautious trading approach:
- Wait for price to close back through the trendline just mentioned, accompanied by a sudden increase in volume.
- A reasonable stop-loss level is usually placed above or below the top/bottom of that throw-over itself.
- The price target will go to the starting point of the Diagonal pattern, that is, the extreme of point number 2.
This approach does not guarantee profit. The Diagonal is still a rare pattern, and a completely erroneous wave count can occur before the throw-over is clearly confirmed.
What Is the Leading Diagonal Pattern in Elliott?
The Leading Diagonal is the leading diagonal wave pattern, appearing in the wave 1 position of an impulse sequence, or wave A of a zigzag/double/triple sequence. This is a variation discovered by Elliott researchers much later than the Ending Diagonal, and its frequency of occurrence in practice is also not high.
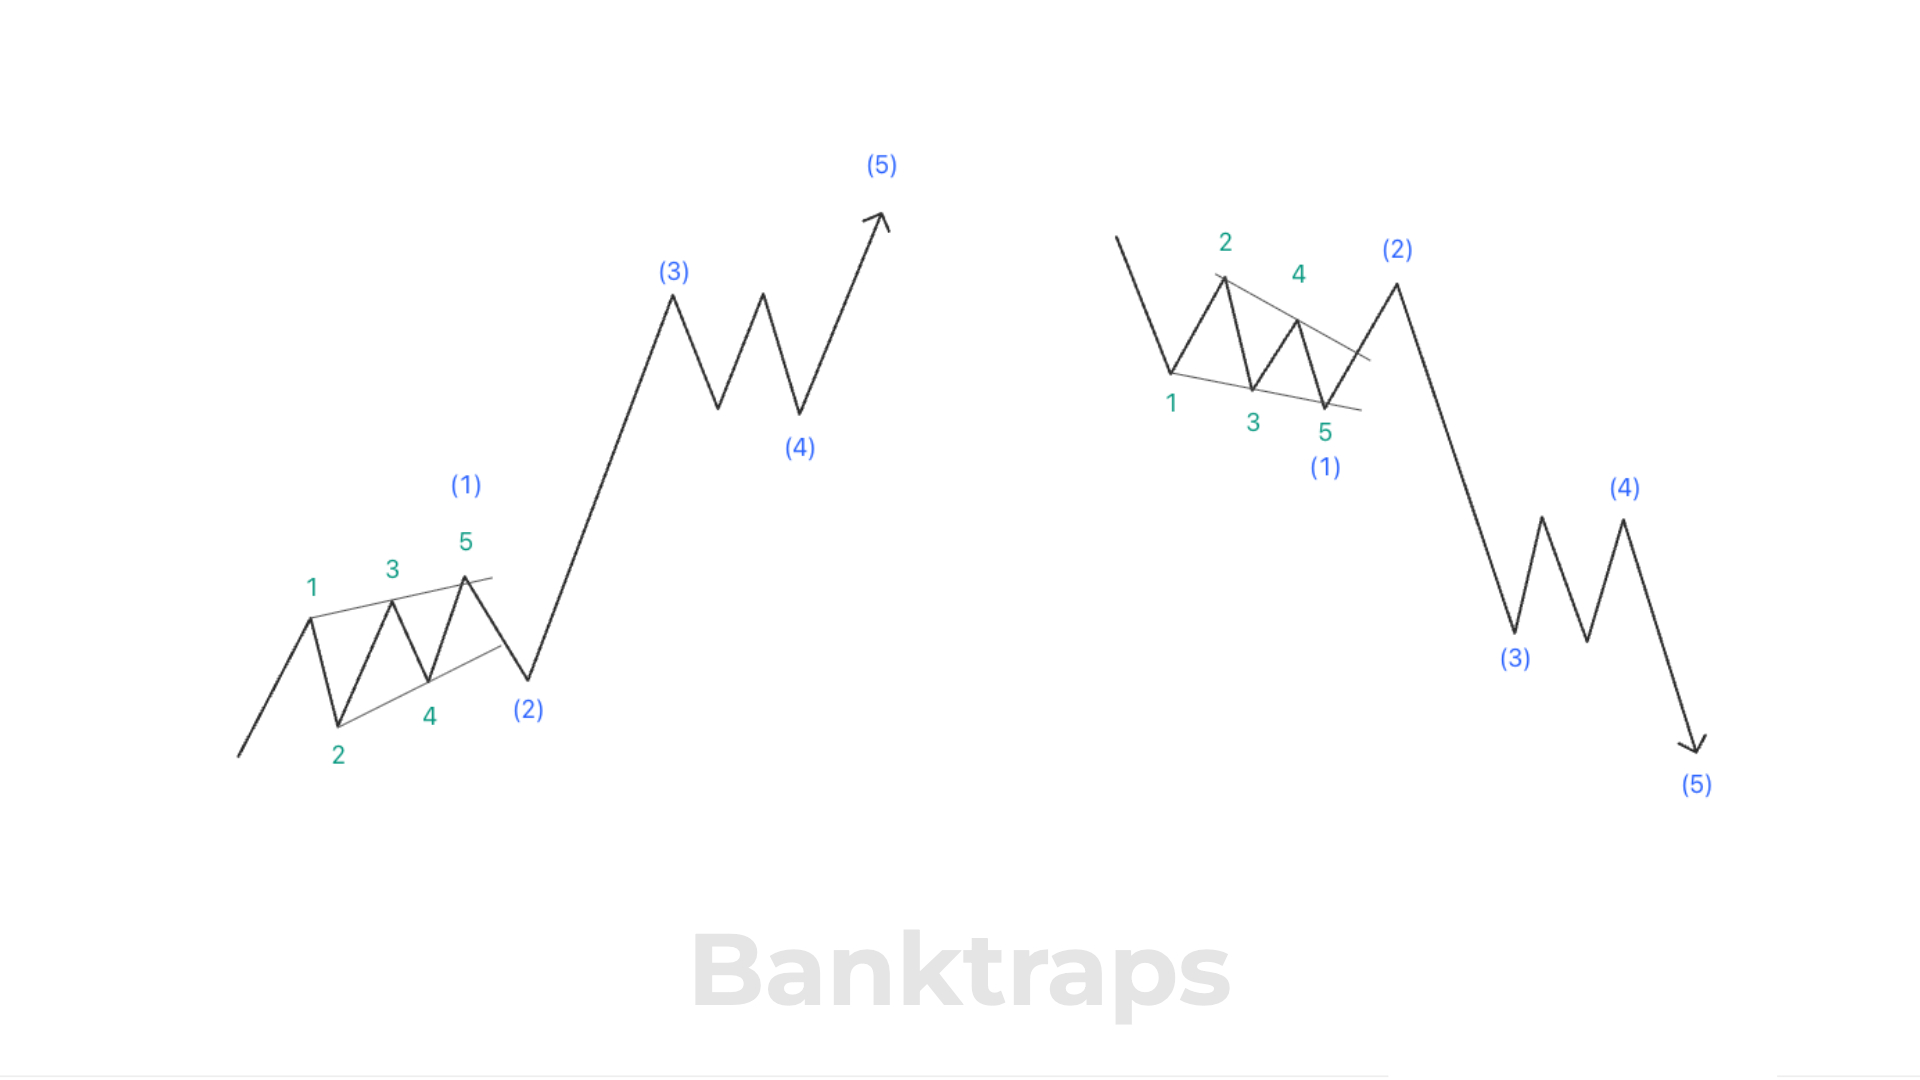 Figure 7: The Leading Diagonal in uptrends and downtrends
Structure of the Leading Diagonal
The leading diagonal still retains the wave one - wave four overlap characteristic and the converging wedge shape like the ending diagonal. The difference lies in the sub-wave structure; this pattern can carry two structures:
- 3-3-3-3-3: the internal sub-waves are all made up of 3 waves (zigzags).
- 5-3-5-3-5 (more common): the motive waves 1, 3, 5 inside subdivide into 5 smaller waves (impulses) instead of 3, creating a 5-3-5-3-5 sequence.
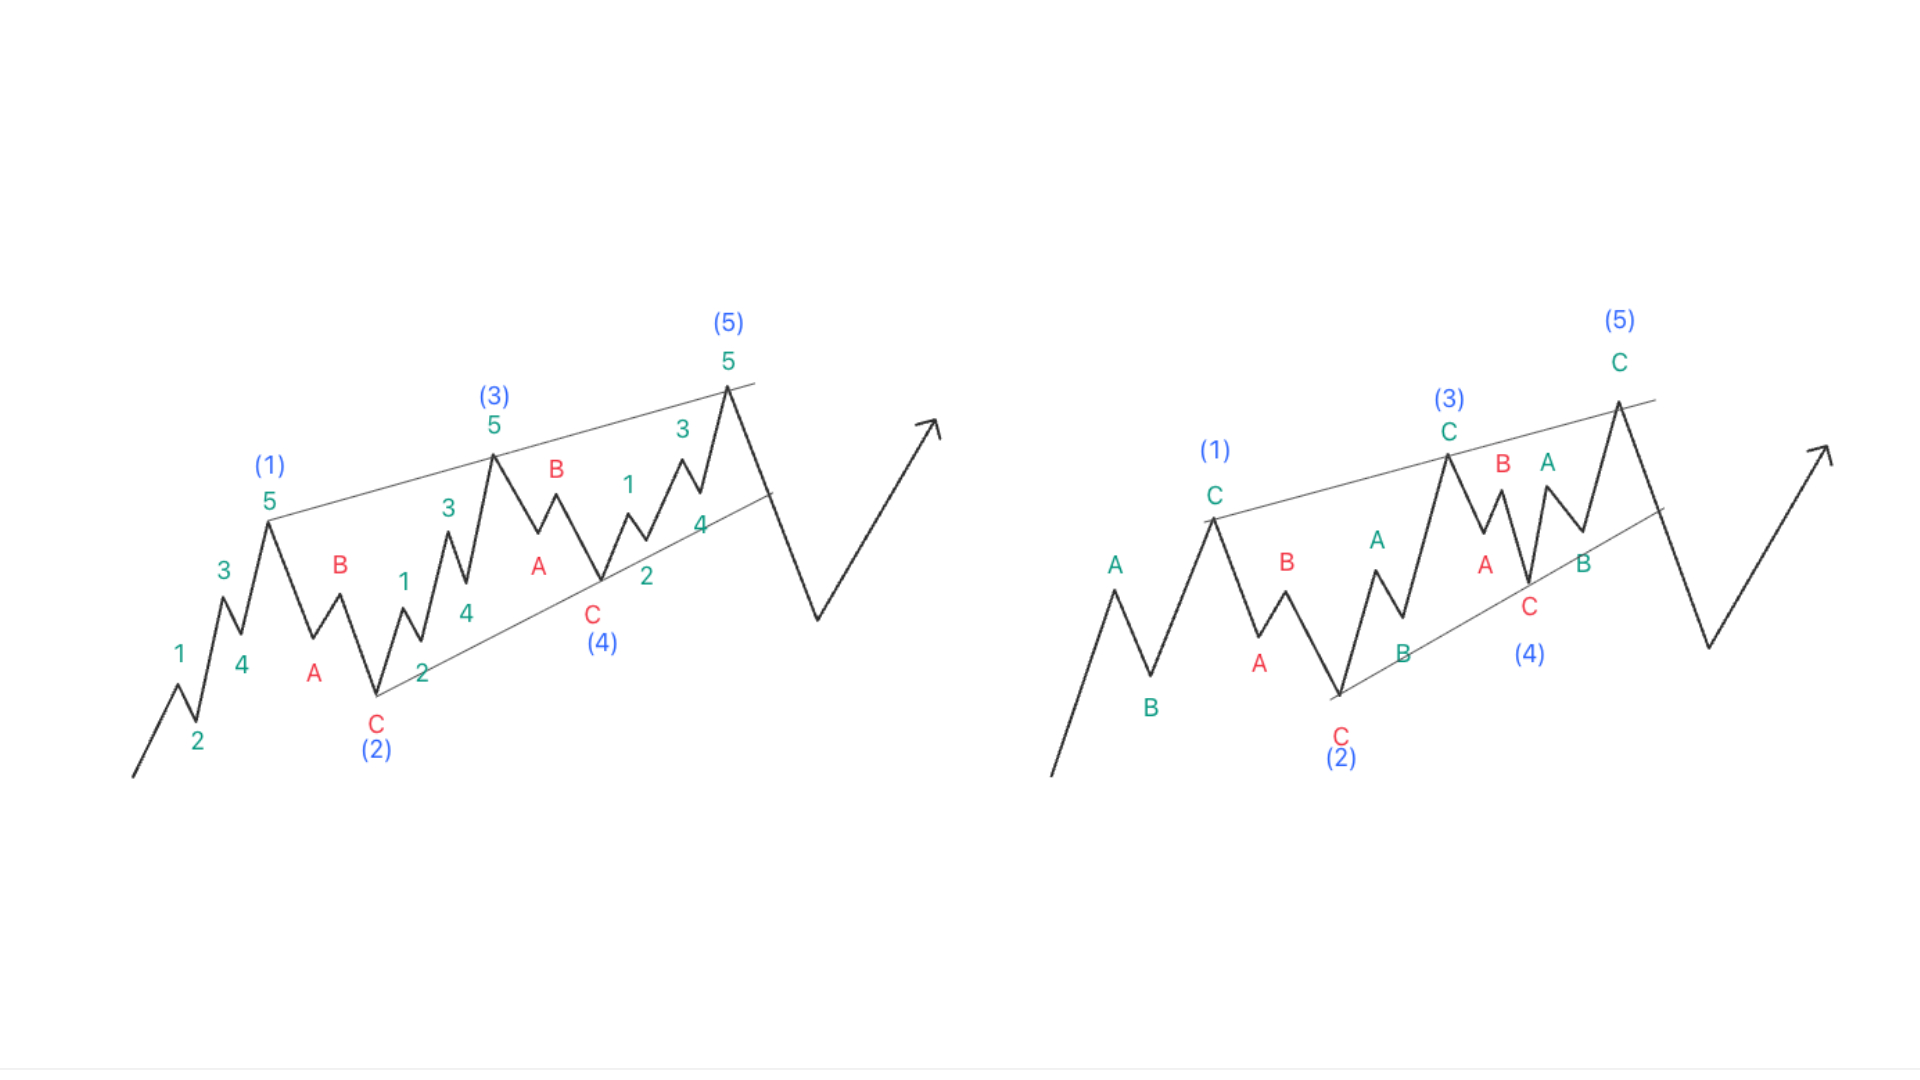 Figure 8: The Leading Diagonal consists of 2 types of structure, 3-3-3-3-3 and 5-3-5-3-5
Comparison table of the two Leading Diagonal structures:
| Characteristic | 5-3-5-3-5 | 3-3-3-3-3 |
|---|---|---|
| Strength | Stronger | Weaker |
| Motive waves | Impulse | Zigzag |
| Degree of consensus | High | Low |
| Potential for continuation | High | Lower |
| Psychology | Confident | Hesitant |
What Does a Leading Diagonal Forecast?
A leading diagonal carries two different messages:
- The 5-3-5-3-5 structure is more common and true to the spirit of a motive wave, conveying a message of trend continuation
- The 3-3-3-3-3 structure is rarer, showing that the start of the trend is still weak and doubtful. Because even the motive waves 1, 3, 5 in the structure have only 3 waves, expressing the tug-of-war between the two sides and that the new trend is not yet trusted.
Usually, after a Leading Diagonal ends, price will pull back to the area lying between wave 2 and wave 4.
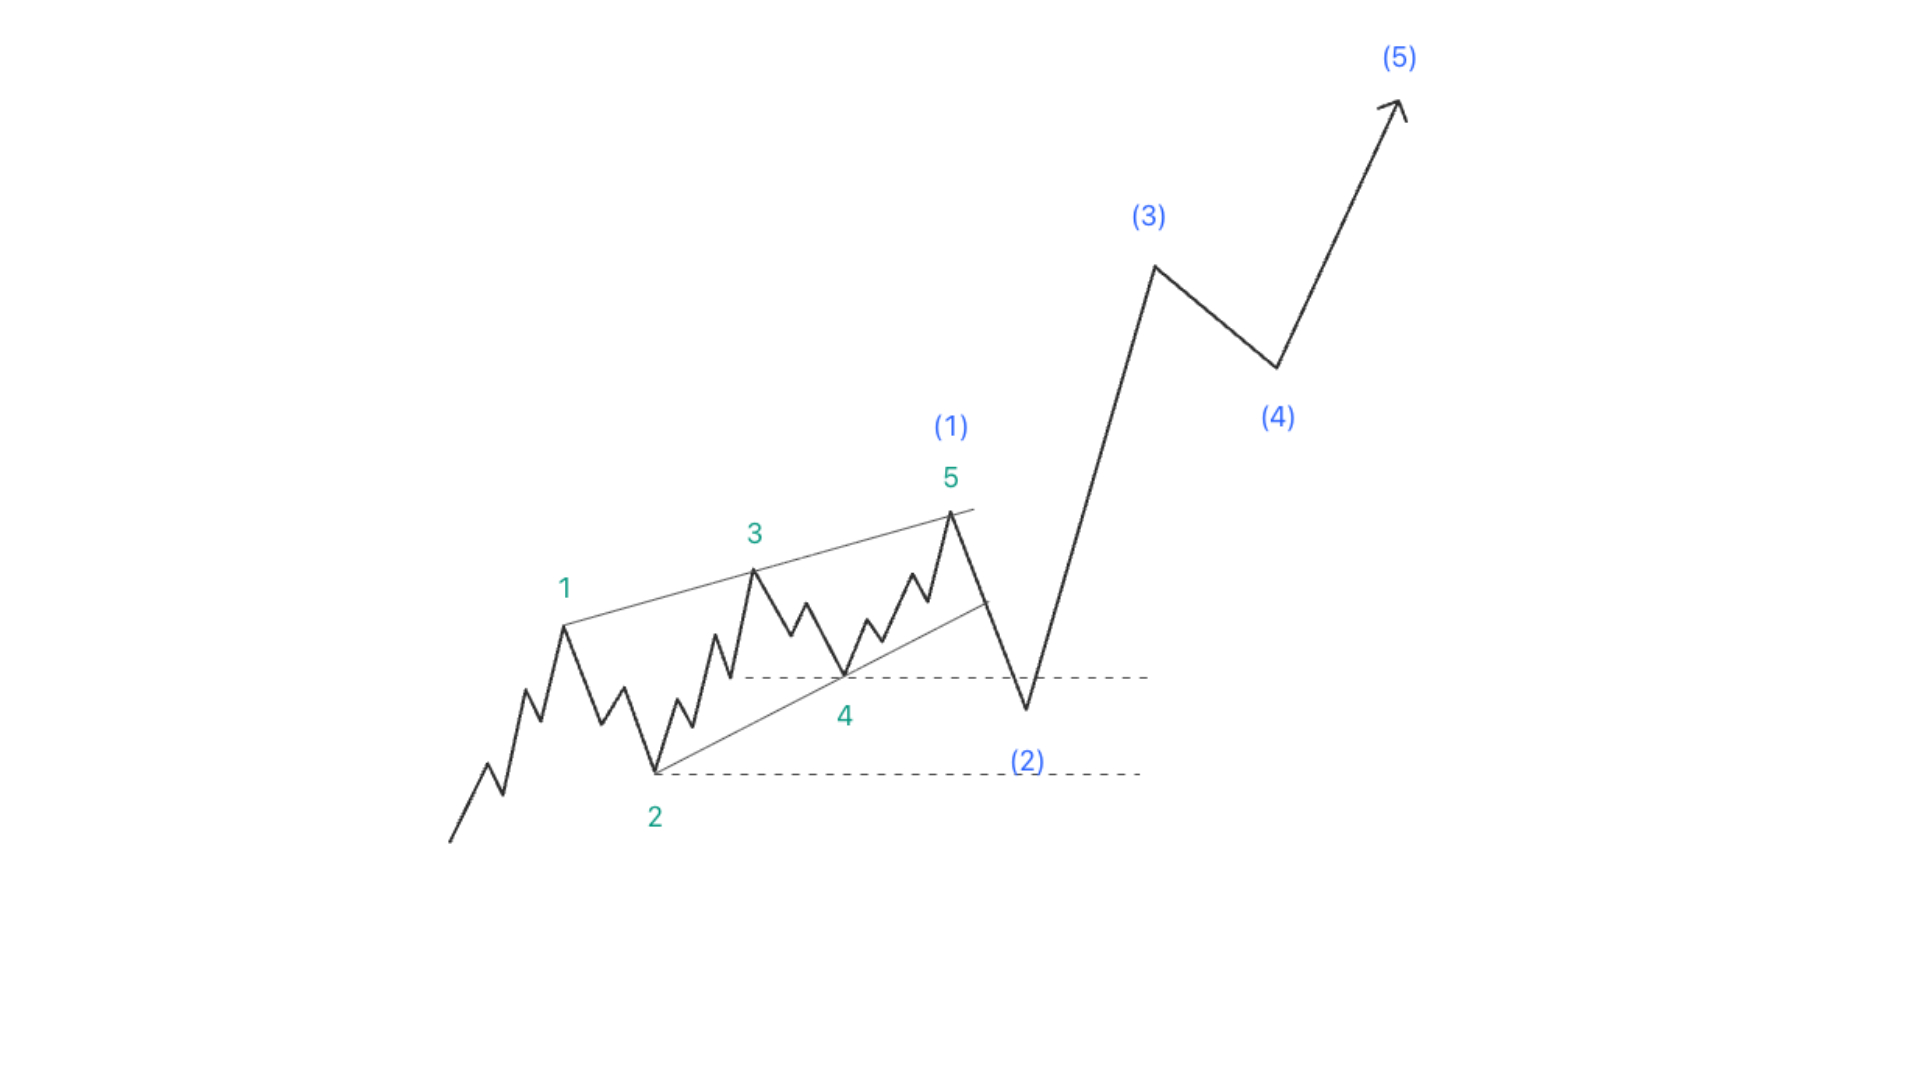 Figure 9: After a leading diagonal, price pulls back to the 2-4 area and then continues to rise
Note: Throw-over is not a characteristic phenomenon of the leading diagonal. Wave 5 in a leading diagonal may touch, nearly touch, or slightly exceed the 1-3 trendline.
How to distinguish a Leading Diagonal from a normal 1-2 wave sequence
The most common mistake when encountering a Leading Diagonal is mistaking it for a normal 1-2, 1-2 wave sequence repeating many times. The key to distinguishing them lies in the speed of price movement: in a Leading Diagonal, the sub-wave 5 moves noticeably more slowly compared to the sub-wave 3.
Conversely, in a genuine 1-2, 1-2 sequence, the speed of short-term movement tends to gradually increase, and market breadth (the number of stocks participating in the trend) also usually expands along with it. Observing these two characteristics helps traders avoid miscounting waves right from the early stage.
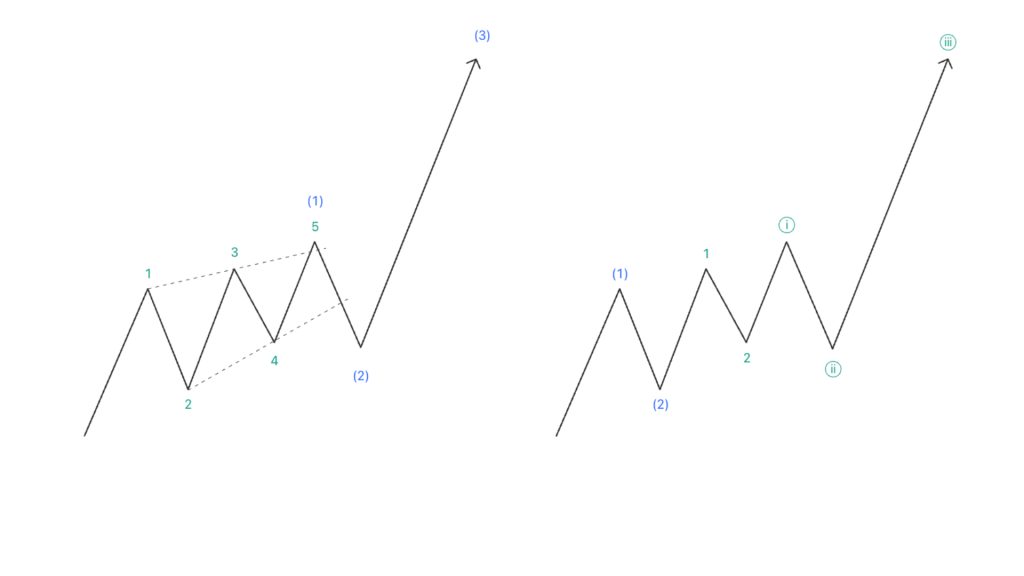 Figure 10: How to distinguish a leading diagonal from a 1-2 impulse wave sequence
Comparing the Leading Diagonal and the Ending Diagonal
Quick comparison table of the 2 Elliott Diagonal patterns:
| Criterion | Ending Diagonal | Leading Diagonal |
|---|---|---|
| Position of appearance | Wave 5 or wave C | Wave 1 or wave A |
| Sub-wave structure | 3-3-3-3-3 | 5-3-5-3-5 or 3-3-3-3-3 |
| Market meaning | Ending, trend exhaustion | Continuation of the main trend |
| Wave 1-4 overlap | Yes | Yes |
| Boundary shape | Converging wedge (rarely expanding) | Converging wedge (rarely expanding) |
| Degree of commonness | More common | Rarer |
| Risk of confusion | With an impulse with an elongated wave 5 | With a repeating 1-2 wave sequence |
| Throw-over | Usually occurs | May or may not occur |
Expanding Diagonal Variation
Both the Ending Diagonal and the Leading Diagonal can appear in expanding form, that is, the two boundary lines expand instead of converging as in the common form.
This variation is very rare in practice, and the recorded cases show markedly lower analytical reliability, because it is usually accompanied by an unusually short wave three or a larger-than-normal pattern scale. Traders should prioritize the converging form when counting waves, and only consider the expanding form when every other possibility does not fit.
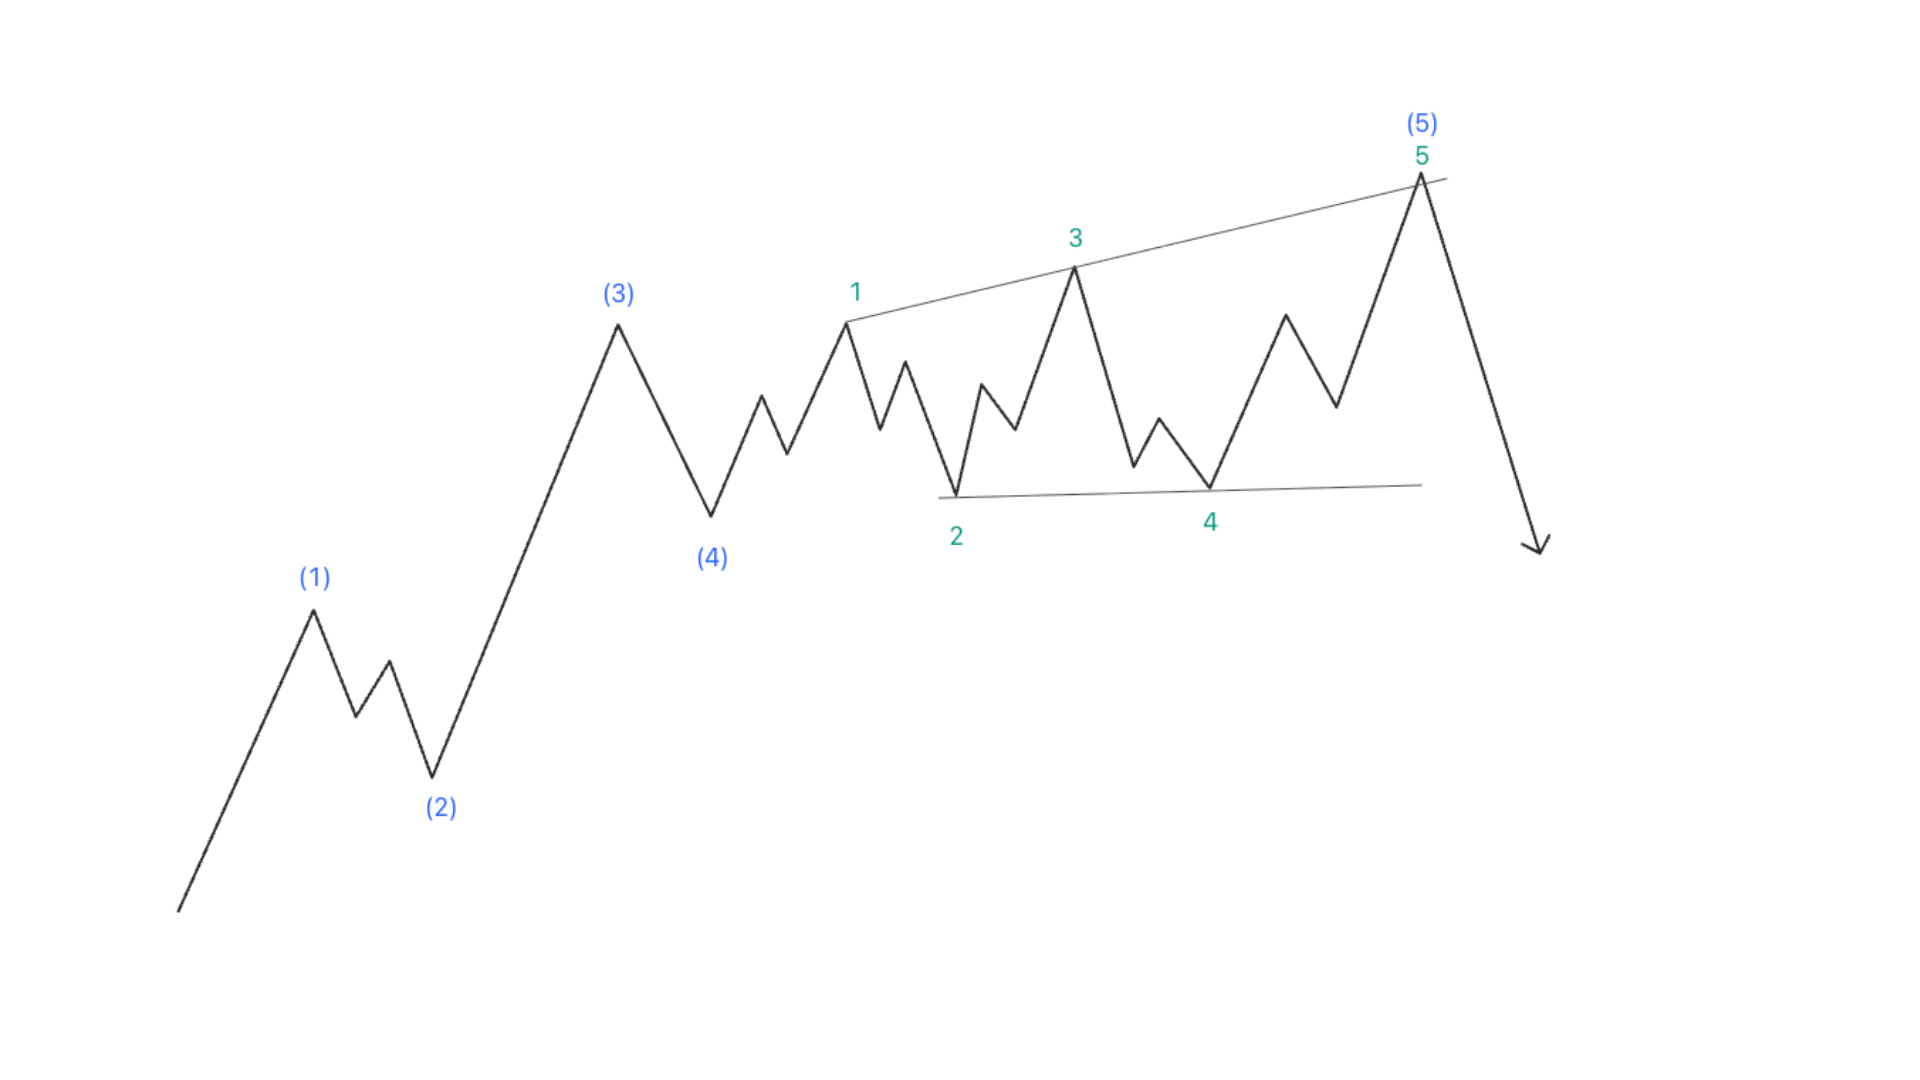 Figure 11: The expanding diagonal pattern has 2 diverging trendlines
FAQ — Frequently asked questions about diagonal waves
Does an ending diagonal always occur in wave 5?
Not entirely. The ending diagonal appears mainly in wave five of an impulse sequence, but there is still a small proportion that appears in wave C of an A-B-C structure, or in the final wave C in a double three or triple three. Whatever the position, the common point is that it always signals the end of a larger wave structure.
Is the leading diagonal common?
No. This is a rare variation, recognized by Elliott researchers much later than the ending diagonal. Because of this rarity, most material and even practical traders usually focus their attention on the ending diagonal, making the leading diagonal easy to overlook or to miscount as a repeating 1-2 wave sequence.
Can a Diagonal be truncated?
Yes, but extremely rarely. Elliott noted that a Diagonal sometimes ends with a truncation, that is, the sub-wave five does not exceed the top of the sub-wave three. However, the difference in truncated cases of a Diagonal is usually very small, almost falling short by only a minimal amplitude compared to the top of wave three.
How does a Diagonal differ from a Triangle (corrective triangle)?
The two patterns are easily confused because they both have a narrowing triangular shape on the chart. The difference lies in their nature: a Diagonal is a motive wave, moving in the same direction as the main trend and always overlapping waves 1-4. A Triangle is a corrective wave, usually moving sideways and appearing in the wave four, wave B or wave X position, not carrying the meaning of pushing price along the main trend like a Diagonal.
Should you enter a trade immediately upon detecting an Ending Diagonal?
You should not. Counting waves when a Diagonal has not yet completed is very prone to error, because the 3-3-3-3-3 structure can be mistaken for many other corrective patterns still in progress. A safer approach is to wait for throw-over confirmation, and only then consider a position in the expected reversal direction.
Rate this article
Read structure 10x faster with JUKA
JUKA maps SMC structure — swings, BOS, CHoCH and inducement zones — automatically on any TradingView chart. No more hand-drawing structure for hours.
Get JUKA — $150