Lesson 3: Motive Waves and Corrective Waves – Distinguishing the Two Types of Elliott Waves
Every price chart contains only two types of waves: motive waves and corrective waves in Elliott Wave. A motive wave has a structure of 5 sub-waves and moves in the same direction as the larger trend it belongs to. A corrective wave has a structure of 3 sub-waves, moves against that trend, and retraces only a portion of it rather than reversing it completely.
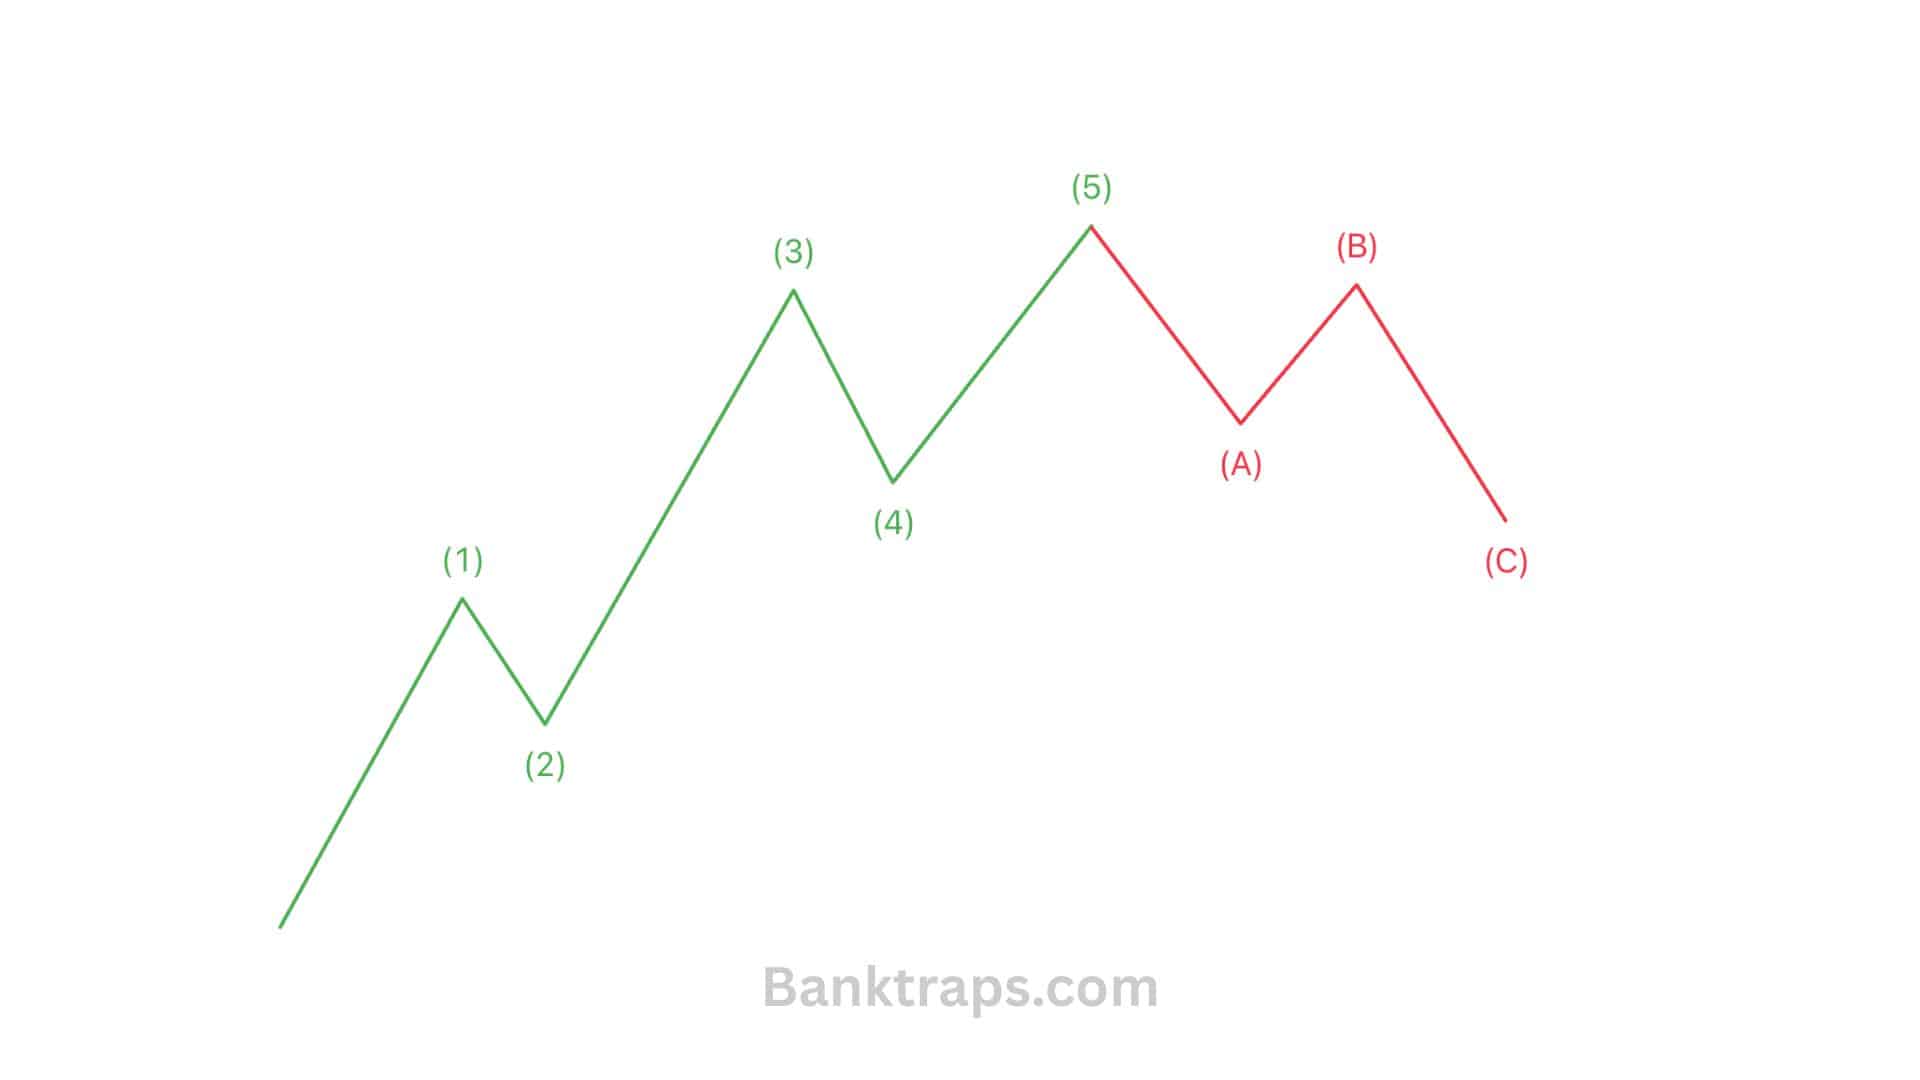 Figure 1: 5 motive waves and 3 corrective waves in Elliott Wave
What Is a Motive Wave in Elliott Wave?
A motive wave is a wave with a structure of 5 sub-waves that always moves in the same direction as the trend of the larger-degree wave of which it is a component. A motive wave plays the role of the "action wave": it directly pushes price forward in line with the main trend.
A motive wave is numbered from 1 to 5. Within a cycle, the three sub-waves 1, 3 and 5 of a motive wave all move in the same direction as the larger-degree trend, while waves 2 and 4 move against the larger-degree trend and are only temporary interruptions.
Elliott identified two forms of motive wave: impulse and diagonal. Of these, impulse is the most common form, while diagonal appears only in special positions on the chart (at the beginning or the end of a trend).
Trading Hub 3.0 will explore the internal structure of each form in depth in dedicated articles. Here, you only need to grasp the general principle: a motive wave has 5 waves and always moves with the trend.
What Is a Corrective Wave in Elliott Wave?
A corrective wave is a wave with a structure of 3 sub-waves, or a variation of a 3-wave structure, that moves against the trend of the larger-degree wave. A corrective wave is not meant to reverse the trend; instead, it plays the role of the "reaction wave": it retraces a portion of the progress that the preceding motive wave created.
Wave 2 and wave 4 within a motive wave are typical examples of corrective waves.
Corrective waves are labeled with the letters A, B, C. Among them, wave A and wave C, although both move against the larger-degree trend, are themselves still motive waves. The reason is that wave A moves "with the trend" relative to the A-B-C corrective wave itself, of which it is a sub-wave, and the same is true of wave C. Meanwhile, wave B, because it moves against the A-B-C corrective wave of which it is a sub-wave, is a corrective wave (see the relativity of waves in Lesson 1 – The Elliott Wave Cycle).
Comparison Table: Motive Waves vs. Corrective Waves
Below is a head-to-head comparison table to help traders quickly visualize the difference.
| Criterion | Motive Wave | Corrective Wave |
|---|---|---|
| Number of sub-waves | 5 waves | 3 waves (or a variation of 3 waves) |
| Wave labels | Numbers (1, 2, 3, 4, 5) | Letters (A, B, C…) |
| Direction of movement | Same direction as the larger trend | Opposite direction to the larger trend |
| Role | Action | Reaction |
| Ease of identification | Moves decisively, easy to count | Is "resisted" by the larger trend, harder to count |
| Number of structural forms | 2 forms: Impulse, Diagonal | 3 basic forms: Zigzag, Flat, Triangle (and combination forms) |
The most noteworthy point in the table above is in the "ease of identification" row. The Elliott Wave Principle describes that a motive wave always moves with relative ease in the direction of the larger trend, while a corrective wave has to "tug-of-war" between two opposing trends, making it far less clear. This is also why beginner traders tend to miscount waves during the corrective phase more than during the motive phase.
The Elliott wave structure only works correctly when a motive wave keeps 5 waves and a corrective wave keeps 3 waves:
- A motive wave has the task of creating progress for the trend → it needs a full 5 movements to accomplish that.
- A corrective wave only retraces a portion of the preceding motive wave; it does not need to "shoulder" the task of creating new progress → it only needs 3 movements to complete its retracement role.
How to Distinguish a Motive Wave from a Corrective Wave?
When looking at an actual price segment, there are three signs that help you quickly distinguish these two types of waves before going into a detailed wave count:
- Count the observable sub-waves. If a price segment can be divided into 5 distinct movements, it is most likely a motive wave. If it can only be divided into 3 movements, it is most likely a corrective wave.
- Compare its direction with the adjacent larger-degree trend. A price segment moving in the same direction as the larger trend is usually a motive wave, while a segment moving in the opposite direction is usually a corrective wave.
- Observe the speed and slope of the movement. A motive wave usually moves decisively, with an even slope. A corrective wave is usually slower, with a tendency to move sideways or drag on.
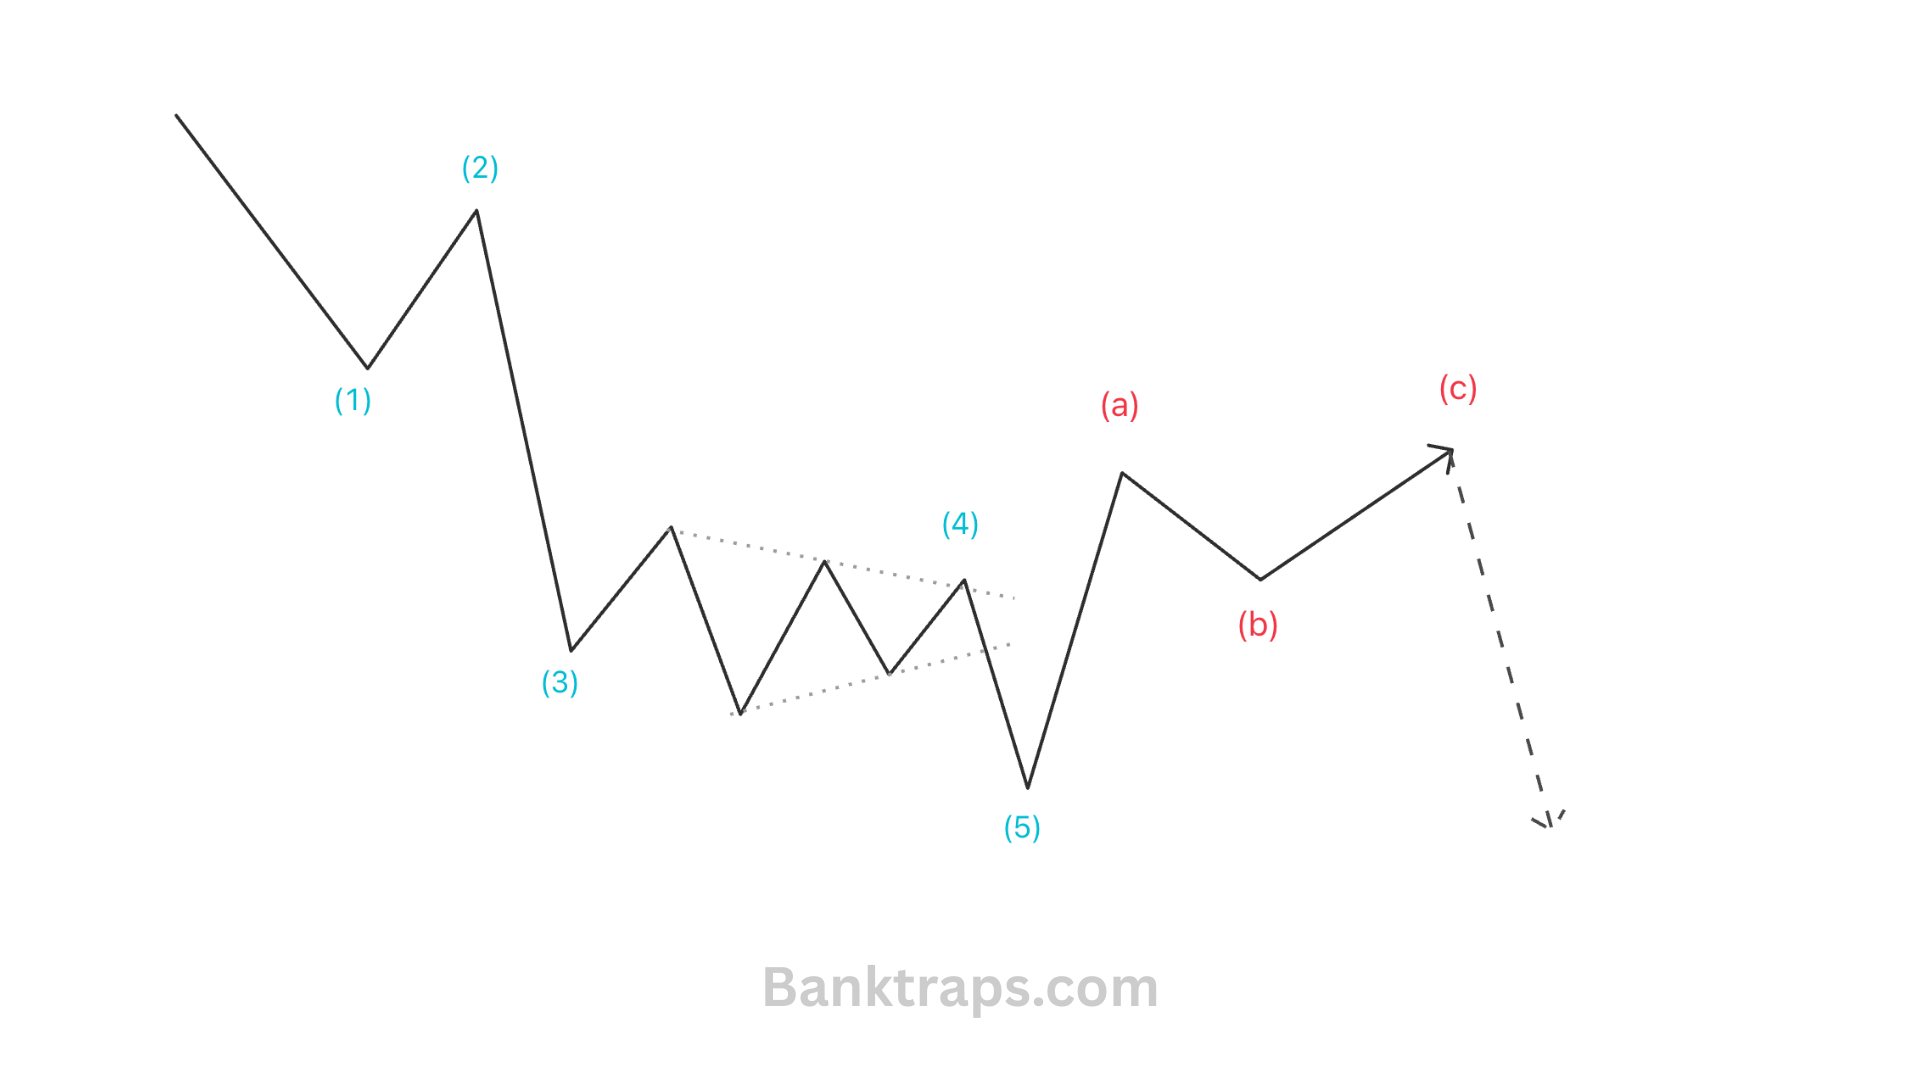 Figure 3: Distinguishing motive waves and corrective waves on a price chart
The third sign is particularly useful in real trading. In Figure 3, the slope of wave 3 is much steeper than that of wave 1, which is commonly seen in an impulse motive move. The slope of wave C is clearly lower than that of wave A within the three-wave recovery itself, which is precisely a signal that the larger downward momentum is about to return rather than a genuine reversal.
What Forms Do Motive Waves and Corrective Waves Take?
Both motive waves and corrective waves are further divided into many specific structural forms, each with its own wave-counting rules. Knowing this list helps traders understand what they need to learn next after distinguishing motive and corrective waves at an overview level.
Motive waves have 2 forms:
- Impulse (the common form, with a 5-3-5-3-5 structure)
- Diagonal (a special form, appearing at the beginning or end of a trend).
Corrective waves have 3 basic forms:
- Zigzag (a fast form, with a 5-3-5 structure)
- Flat (a sideways form, with a 3-3-5 structure)
- Triangle (a converging or expanding form, with a 3-3-3-3-3 structure).
- In addition, there are combination forms (Combination) when two or more corrective patterns connect with each other.
This article stops at listing them so you have an overall picture. The detailed structure of the Impulse Wave, the Diagonal, and each specific corrective form will be analyzed separately in the following articles in this series.
FAQ: Frequently Asked Questions About Motive and Corrective Waves
Between motive waves and corrective waves, which is more reliable for entering a trade?
Motive waves are more reliable for entering trades in line with the main trend because they move decisively and follow strict rules (wave 2 does not exceed the starting point of wave 1, wave 3 is not the shortest wave, wave 4 does not overlap the price territory of wave 1). Corrective waves are harder to trade because their structure varies into many forms and they are often caught in a "tug-of-war" between two opposing trends, making their ending point difficult to predict accurately.
Is it true that any wave moving against the larger trend is a weak wave with only 3 waves?
Not entirely true. The Elliott Wave Principle recognizes some exceptional cases: waves that move in the same direction as the trend but nevertheless develop in corrective mode (3 waves), such as the sub-waves within an ending diagonal or wave A in a flat correction. This is advanced knowledge; beginners do not need to memorize the details right away, only to know that the relationship between direction and the number of sub-waves is not always as absolute as the basic rule suggests.
How does wave degree affect the distinction between motive and corrective?
Wave degree determines that whether a wave is considered motive or corrective is always relative, not absolute. The same price segment can be wave A (part of a corrective wave) at a larger degree, yet itself be a complete motive wave at a smaller degree. Therefore, before classifying a wave as motive or corrective, a trader needs to clearly determine which wave degree they are observing relative to the adjacent larger wave.
Rate this article
Read structure 10x faster with JUKA
JUKA maps SMC structure — swings, BOS, CHoCH and inducement zones — automatically on any TradingView chart. No more hand-drawing structure for hours.
Get JUKA — $150